
Measuring Panel Diversity Using Social Disadvantage Indices and an Entropy Index
By Khadija Hafsia, Data Data Digital data Find out more Analyst; Diane Maillot-Tchofo, Data Analyst, and Aurélie Vanheuverzwyn, Executive Director of Data & Methods – Médiamétrie
14th Francophone Conference on Surveys, 19-22 May 2026, Vannes
Social diversity is a multidimensional concept encompassing questions such as economic, cultural, and religious background. However, the processing processing Means any operation or set of operations which is performed on personal data or on sets of personal data, whether or not by automated means, such as collection, recording, organisation, structuring, storage, adaptation or alteration, retrieval, consultation, use, disclosure by transmission, dissemination or otherwise making available, alignment or combination, restriction, erasure or destruction Find out more of sensitive data sensitive data Sensitive data is a special category of personal data. This is information which reveals the alleged racial or ethnic origin, political opinions, religious or philosophical beliefs or trade union membership, as well as the processing of genetic data, biometric data for the purpose of uniquely identifying a natural person, data concerning health or data concerning the sexual life or sexual orientation of a natural person. GDPR prohibits collecting or using this data, except, in particular, in the following cases: if the data subject has given their express consent (active, explicit and preferably written approach, which must be free, specific, and informed); if the information is clearly made public by the data subject; if they are necessary to safeguard human life; if their use is justified by the public interest and authorised by the CNIL; if they concern the members or adherents of a political, religious, philosophical, political or union association or organizsation. Find out more —such as racial or ethnic origin, political opinions, or religious beliefs—is authorized by the CNIL only in specific cases, such as when it is in the public interest or to protect human life.

Médiamétrie, as a private polling firm specializing in
Audience Measurement
Audience Measurement
Quantitative study of the frequency of use of media.
Find out more
, does not meet the required criteria. Nevertheless, the
question
question
An inquiry posed in the same way to all participants in the same survey, with the goal of obtaining answers of the same nature. We distinguish closed questions whose responses are chosen from the options provided (scales, yes / no, classification options, etc.), from open-ended questions for which no answer categories are offered. In the latter case, the spontaneous answer of the interviewee is gathered.
Find out more
of the representativeness of Audience Measurement panels—beyond traditional sociodemographic criteria—is a key concern for its clients. For example, in its draft 2024–2028 Contract of Objectives and Means (COM), France Télévisions has made commitments regarding diversity and inclusion in its programming.
To address this issue, two approaches can be taken: adding questions to panellist recruitment questionnaires or using a
Proxy
Proxy
A proxy server that creates a screen between the internet user and the web servers. The proxy may be transparent at the internet service provider end in order to record and analyse subscriber traffic for an operator (e.g., for filtering purposes or for judicial investigations).
Find out more
derived from official
data
data
Digital data
Find out more
. The first option presents a number of operational constraints. Information on
household
household
In the statistical sense of the term, a household refers to all occupants of the same dwelling, whether they are related or not. A household may be composed of a single person. Household populations therefore effectively exclude some communities (workers' hostels, retirement homes, university residences, prisons, etc.), the homeless, seamen and people living in mobile homes.
Find out more
income, for example, is often not reported in its entirety or is subject to measurement errors (e.g., gross vs. net, before vs. after taxes, individual income vs. household income, etc.). The second option relies on data from official
statistics
statistics
Statistics or Data Science is a field of mathematics that studies phenomena through data collection, processing, analysis, graphical representation and visualisation (Data Visualisation), as well as the interpretation of results.
Find out more
, for which we have reliable benchmarks against which to compare the structures of our
panel
panel
A sample from which information is collected over time. It can be questioned several times at regular intervals. This method is pertinent for studying changes in behaviour.
The sample can be questioned continuously:
- either: each individual in the panel is asked to fill in a daily questionnaire relating to the subject of the study. This is the case for the Radio panel.
- or the information is recorded and returned regularly. This is the case for the Médiamat panel. This method is pertinent for understanding behavioural patterns and their changes if the panel lasts long enough.
Find out more
surveys.
By opting for the second approach, we selected four indicators: two deprivation indices (one French and one European), as well as a poverty index and a wealth index. These indices are calculated at the IRIS level. Our approach consists of associating each Panellist with the value of their IRIS index. In addition, we identified the entropy index, which measures diversity based, in particular, on characteristics directly available in our data.
1. Background and Data Data Digital data Find out more
To measure television viewership, Médiamétrie uses its
Médiamat
Médiamat
Registered name, the Médiamat is the benchmark in television audience measurement in France. Carried out by Médiamétrie, it provides daily audience figures for programmes watched anywhere, on any screen, live, timeshifted, on replay or preview, by all French people aged 4 and over, i.e. 62.4 million individuals.
The measurement is based on 2 representative panels :
- A first panel of around 12,000 individuals in 5,500 households, comprising :
• 5,000 households equipped with home TV sets, each connected to a fixed audimeter, the source of home TV audience measurement
• 500 households without home TV sets
- A second panel of around 5,000 individuals carrying a personal portable meter to measure TV audiences out of home (all screens) and on Internet screens at home. These audiences are then attributed to the individuals in the first panel by statistical fusion. The Médiamat allows Médiamétrie to monitor audience behaviour on a daily basis, while offering the possibility of both editorial and advertising analysis.
Find out more
and
Personal Portable Audience Meter (PPAM)
Personal Portable Audience Meter (PPAM)
A people meter in the form of a small box that is worn by the panellist around their neck, waist or wrist. This box analyses the ambient sound to detect the panellist's exposure to TV or Radio media. It periodically transmits its measurements to the servers at the audience measurement company, either autonomously via a cellular network, or by connecting via Bluetooth to a station installed in the panellist’s home.
Find out more
panels. The Médiamat
panel
panel
A sample from which information is collected over time. It can be questioned several times at regular intervals. This method is pertinent for studying changes in behaviour.
The sample can be questioned continuously:
- either: each individual in the panel is asked to fill in a daily questionnaire relating to the subject of the study. This is the case for the Radio panel.
- or the information is recorded and returned regularly. This is the case for the Médiamat panel. This method is pertinent for understanding behavioural patterns and their changes if the panel lasts long enough.
Find out more
consists of approximately 5,600 households living in metropolitan France, regardless of whether they own a television. Households with a television have a fixed
Audience Meter
Audience Meter
A device for measuring the audience of radio or television programmes. Audience meters automatically register whenever a TV or radio is switched on or off, as well as each change of channel, and each time recorded content is played on the decoder, or catch-up / preview services are viewed. They also allow for individual audience measurement via a remote control with push buttons; each member of the household has their own button which they use to state their presence in the room. The audience meter is connected via the telephone network to a computer that collects and processes the data gathered.
Find out more
connected to their TV sets. All individuals aged 4 and older in the panel households participate in the television
audience measurement
audience measurement
Quantitative study of the frequency of use of media.
Find out more
.
The AIP panel consists of approximately 6,000 individuals aged 13 and older. Panellists are equipped with an Audience Meter that they carry both at home and when they are out. For both panels, each
household
household
In the statistical sense of the term, a household refers to all occupants of the same dwelling, whether they are related or not. A household may be composed of a single person. Household populations therefore effectively exclude some communities (workers' hostels, retirement homes, university residences, prisons, etc.), the homeless, seamen and people living in mobile homes.
Find out more
(for the Médiamat panel) or each
panellist
panellist
An individual who participates in a panel.
Find out more
(for the AIP panel) is characterized by household data, such as the number of people in the household (npf), the
SPG categories
SPG categories
The SPG (socio-professional category), was replaced in 1982 by the classification of Professions and Socio-professional Categories (PCS), a nomenclature defined by France’s INSEE, which classifies the population according to a combination of profession (or former profession), hierarchical position and status (employee or otherwise).
Find out more
of the household
reference person
reference person
The reference person in a household is defined by INSEE according to rules based on the predominance given to couples, employment, and age: The reference person in a household is:
- the oldest working person with a spouse;
- in the absence of a working person with a spouse, the oldest person with a spouse;
- in the absence of a person with a spouse, the oldest working person;
- in the absence of a working person, the oldest person.
Find out more
(HRP), their department of residence, whether they own a television, etc., as well as
individual data
individual data
All the information gathered or recalculated for a single individual in the sample.
Find out more
such as the age of household members, their SPG categories, and their mobile phone ownership.
We have sociodemographic data, as well as data on equipment, subscriptions, and multimedia usage. The various levels of data granularity allow us to analyze the panels at both the Household and individual levels.
To ensure an accurate and relevant Audience Measurement of the television
audience
audience
The set of listeners, viewers, or TV viewers in which each individual is equally weighted, regardless of their listening/viewing duration or frequency of contact.
Find out more
, we must ensure that our panels are properly
representative
representative
A sample is said to be representative when it has been generated via a representative draw, meaning that each individual in the population had a non-zero probability of being selected. Representativeness relates to the sample and not to a unit of the population. It is not synonymous with a proportional sample or a "reduced model" of the population studied. In survey theory, it has been demonstrated that an optimal sampling strategy consists of organising the sample according to the variables that are most correlated to the subject of the study.
Find out more
according to the various criteria mentioned above, particularly the social diversity of our panellists. Social diversity is a multidimensional concept, encompassing questions such as economic, cultural, and religious background. However, the
processing
processing
Means any operation or set of operations which is performed on personal data or on sets of personal data, whether or not by automated means, such as collection, recording, organisation, structuring, storage, adaptation or alteration, retrieval, consultation, use, disclosure by transmission, dissemination or otherwise making available, alignment or combination, restriction, erasure or destruction
Find out more
of
sensitive data
sensitive data
Sensitive data is a special category of personal data.
This is information which reveals the alleged racial or ethnic origin, political opinions, religious or philosophical beliefs or trade union membership, as well as the processing of genetic data, biometric data for the purpose of uniquely identifying a natural person, data concerning health or data concerning the sexual life or sexual orientation of a natural person.
GDPR prohibits collecting or using this data, except, in particular, in the following cases:
if the data subject has given their express consent (active, explicit and preferably written approach, which must be free, specific, and informed);
if the information is clearly made public by the data subject;
if they are necessary to safeguard human life;
if their use is justified by the public interest and authorised by the CNIL;
if they concern the members or adherents of a political, religious, philosophical, political or union association or organizsation.
Find out more
such as racial or ethnic origin, political opinions, or religious beliefs is authorized by the CNIL only in specific cases, such as the public interest or the protection of human life, etc.
Médiamétrie, as a private polling firm specializing in Audience Measurement, does not have access to certain data, such as poverty indicators at fine granularity levels1, and is not authorized to ask its panellists certain questions or to archive their responses. Taking these various constraints into account, we ensure the representativeness of our panels by using indicators developed by social scientists (e.g., demographers) for academic research or public policy purposes.
1 Find poverty indices not available at the time of publication in small IRIS areas with fewer than x number of inhabitants
2. Indicators for Characterizing the Panel Panel A sample from which information is collected over time. It can be questioned several times at regular intervals. This method is pertinent for studying changes in behaviour. The sample can be questioned continuously: - either: each individual in the panel is asked to fill in a daily questionnaire relating to the subject of the study. This is the case for the Radio panel. - or the information is recorded and returned regularly. This is the case for the Médiamat panel. This method is pertinent for understanding behavioural patterns and their changes if the panel lasts long enough. Find out more
We searched the scientific literature for composite diversity indicators and selected four indicators designed to characterize the Panel along the socioeconomic spectrum. These are indices of social deprivation, poverty, and wealth. These indicators provide complementary definitions of disadvantage and poverty, including material poverty and income indicators on the one hand (see F-DEP and the poverty and wealth indices), and indices combining objective poverty variables (income) and subjective ones (perceived financial situation) (see EDI). The indicators mentioned above are calculated at the IRIS level. The IRIS (“Ilots Regroupés pour l’Information Statistique,” or “Grouped Islands for Statistics Statistics Statistics or Data Science is a field of mathematics that studies phenomena through data collection, processing, analysis, graphical representation and visualisation (Data Visualisation), as well as the interpretation of results. Find out more ”) is a geographic division of the territory established by INSEE INSEE The Institut National de la Statistique et des Études Économiques (National Institute for Statistics and Economic Studies) is a general directorate of France's Ministry of the Economy, Finance, and Industry. INSEE carries out several sample surveys in the socio-economic field (households, companies), in addition to its responsibilities for the national accounts and taking the census (last completed in March 1999). This government agency is responsible for coordinating official statistics, reference data produced by the entire public statistics system. Find out more for the dissemination of sub-municipal data data Digital data Find out more . Communes with at least 10,000 inhabitants and a large proportion of those with 5,000 to 10,000 inhabitants are divided into IRIS units. This division constitutes a partition of their territory. France has approximately 16,000 IRIS, including 750 in the overseas departments (DOM). By extension, to cover the entire territory, each Commune Commune The municipality which is the smallest administrative subdivision of the territory. As of 1st January 2020, there were 34,986 communes, of which 34,857 are in mainland France. Find out more in France not divided into IRIS is treated as an IRIS, resulting in a geographic division of the territory into 49,500 urban units.
2.1 Two Indices to Analyze
2.1.1 F-DEP
The social deprivation index known as FDep was developed in the French context [6]. It was constructed at the municipal level using data from the 1999 population population The universe of a survey composed of basic statistical units. These units may be physical persons, households, companies, municipalities, etc. The population serves as a sampling frame for selecting a sample, and as a basis for calculation of the extrapolations from the sample. Find out more census census A technique for gathering information across the entire population, in contrast to a survey, which by definition only applies to a sample. Normally, a census involves an exhaustive count during which some additional socio-demographic questions are asked. Example: the national population census in France by INSEE which publishes results annually. Find out more (INSEE) and 2001 household household In the statistical sense of the term, a household refers to all occupants of the same dwelling, whether they are related or not. A household may be composed of a single person. Household populations therefore effectively exclude some communities (workers' hostels, retirement homes, university residences, prisons, etc.), the homeless, seamen and people living in mobile homes. Find out more tax income data (INSEE-DGI). The same index was calculated using data from 1990. Four variables were used, each representing a fundamental dimension of socioeconomic status, with consistent meaning across the entire country and varying similarly across different categories of urban units: the percentage of blue-collar workers in the working population working population The working population is composed of people performing a professional activity, including the unemployed who have already worked. Find out more , the percentage of 15-year-olds and older with a high school diploma, the percentage of unemployed individuals in the working population, and the median median In statistics, the median is the value that splits all the values into two equal parts. Find out more household income. The index was derived using principal component analysis (PCA) applied to these four variables. The results of the PCA were similar whether the analysis was conducted at the national level or within each urban unit category. The association between social deprivation and mortality over the 1997–2001 period was observed regardless of the spatial scale chosen (Commune, canton, employment area, department, and Region Region Geographic division. Mainland France is organised into 13 administrative regions (INSEE regions - there were previously 22 regions). Find out more ), with the FDep calculated for scales other than the municipal level being obtained as the population-weighted average average The average is one of the most important statistical indicators for a set of numbers. By default, it is the arithmetic mean, calculated by adding the values in the set and then dividing that sum by the number of values. Find out more of the values obtained at the municipal level. Similarly, the association between social deprivation and mortality is found across all urban unit categories. This index is currently used by the CNAM-TS. The index is divided into quintiles based on its distribution distribution This refers to the distribution of a variable; “structure” is also used with this meaning. In statistics, for each x value of a quantitative variable, the distribution function gives the proportion of individuals having a variable value that is less than or equal to x. Find out more : the first quintile corresponds to the most advantaged IRIS areas, and the last quintile to the most disadvantaged IRIS areas. The most recent F-Dep including 2019 data was calculated.
2.1.2 European Deprivation Index
A social deprivation index with a European scope, the EDI or “European Deprivation Index,” has been proposed[5]. The methodology differs from that used for commonly encountered social deprivation indices. It takes Towsend’s definition of deprivation as its starting point and posits that there is no “gold standard” for measuring it in terms of
variable
variable
A computer or statistical object that groups the same information for all individuals in the study population. For example, the AGE variable represents the age of all the individuals of the population studied. Variables can be qualitative (e.g., GENDER or SPG) or quantitative (e.g., AGE or HEIGHT).
Find out more
selection, as these vary by country. The approach therefore consists of defining this concept within the studied population, using relevant variables, before constructing the index. It is based on the selection of a combination of variables that are available both at the individual level in a European
survey
survey
A statistical method that aims to produce information about a population by interviewing part of the population (sample). This word is generally used to mean a survey conducted on a sample that have been interviewed using a questionnaire or else systematically observed.
Find out more
dedicated to the
study
study
Any research done across a population, line of business, or products (programme content, programme schedules, etc.) A study relies most often on the data coming out of a survey (or surveys).
Find out more
of social disadvantage and at the geographic level in the Population Census, and that best reflect the individual experience of social disadvantage. The European survey used is the EU-SILC (European Union – Statistics on Income and Living Conditions) or SRCV in its French version (Statistiques sur Revenus et Conditions de vie), which aims to collect data on income, poverty, social exclusion, and living conditions. This annual survey has included 26 countries since 2005. A logistic
regression
regression
Regression is a supervised machine learning technique focusing on how a target value changes when other values in a dataset change.
Regression problems generally involve continuous variables, such as the way in which square footage and location affect house prices.
Find out more
on the European survey data allows us to retain, among the analyzed variables, only those associated with the deprivation indicator. The regression coefficients associated with each of these variables become the weights of these variables
in the EDI. In its latest version, based on 2017 data (EU-SILC and Census data), the variables used in its calculation are the percentage of:
• households without a car,
• households with more than 6 people,
• single-parent families,
• overcrowded households (i.e., with more than one person per room),
• non-homeowning households,
• unemployed individuals,
• foreign nationals,
• individuals whose occupation is neither managerial nor professional,
• individuals with an educational attainment below the higher education level,
• unmarried individuals.
The index was then divided into quintiles based on its distribution: the first quintile corresponds
to the most advantaged IRIS households, and the last quintile to the most disadvantaged IRIS households.
2.1.3 Poverty and Wealth Indices
To characterize the lower end of the income distribution, the poverty rate is generally used (i.e., the proportion of the population belonging to households whose income is less than or equal to 60% of the national median income per consumption unit). However, there is no standard indicator for defining the upper end. As part of a study on the socioeconomic polarization of neighborhoods in French provincial metropolitan areas, researchers at the University of Bordeaux proposed indicators that summarize the extremes of the income distribution based on deciles of disposable income per consumption unit, data available from IRIS [3] (Gripsiou and Bergouignan, 2021).
The proposed wealth index is calculated as the weighted sum of the positive relative differences between the last three deciles (D7z, D8z,D9z) of each IRIS z, and the corresponding deciles for metropolitan France as a whole (D7
FM
FM
In everyday language, the band of VHF frequencies between 88 MHz and 108 MHz, used for stereo radio broadcasting. It is possible to listen to many radio stations across this band over a local geographic range: public service stations, general interest programmes, musical, special-interest or local programming, etc.
Find out more
, D8FM, D9FM):

The weighting coefficients increase across the deciles so as to give greater weight weight 1. The proportion of a category of individuals in relation to the entire population. For example, on January 1st, 2020, the weight of women was 51.7% of the household population. 2. The survey weight refers to the coefficient assigned to each individual in the sample, and which corresponds to the inverse of the probability that they belong to the sample. For example, for a sample of 20,000 individuals drawn at random from a population of 40 million, the survey weight is 2,000. 3. The adjustment weight refers to the coefficient assigned to each individual after the sample adjustment, and which corresponds to the number of people in the population that are represented by this individual in the sample. Find out more to the gaps associated with the highest incomes.
The poverty index is calculated symmetrically as the weighted sum of the negative relative deviations between the first 3 deciles (D1z,D2z, D3z) of each iris z, with the corresponding deciles for all of metropolitan France (D1 FM FM In everyday language, the band of VHF frequencies between 88 MHz and 108 MHz, used for stereo radio broadcasting. It is possible to listen to many radio stations across this band over a local geographic range: public service stations, general interest programmes, musical, special-interest or local programming, etc. Find out more , D2FM, D3FM):

2.2 Applications & Results
We coded the two panels—that is, by identifying each panellist’s IRIS and associating it with the IRIS index. We did this for all four indices mentioned.
F-DEP
We analyze the
distribution
distribution
This refers to the distribution of a variable; “structure” is also used with this meaning. In statistics, for each x value of a quantitative variable, the distribution function gives the proportion of individuals having a variable value that is less than or equal to x.
Find out more
of AIP panellists aged 15 and older according to their F-DEP values, comparing it to the theoretical distribution of the
Population
Population
The universe of a survey composed of basic statistical units. These units may be physical persons, households, companies, municipalities, etc. The population serves as a sampling frame for selecting a sample, and as a basis for calculation of the extrapolations from the sample.
Find out more
. Overall,
Fig. 1 shows that the distribution of the index is equivalent to the theoretical distribution.
EDI
ICI we analyze the
distribution
distribution
This refers to the distribution of a variable; “structure” is also used with this meaning. In statistics, for each x value of a quantitative variable, the distribution function gives the proportion of individuals having a variable value that is less than or equal to x.
Find out more
of AIP panellists aged 15 and older according to their EDI score, in comparison with the theoretical distribution of the
population
population
The universe of a survey composed of basic statistical units. These units may be physical persons, households, companies, municipalities, etc. The population serves as a sampling frame for selecting a sample, and as a basis for calculation of the extrapolations from the sample.
Find out more
in metropolitan France. According to this index, which takes into account the material aspects of social disadvantage rather than financial aspects, the findings are the same as for the F-DEP (Fig. 2).
Poverty and Wealth Indices
The wealth and poverty indices were calculated based on all IRIS surveys for which income deciles are available. Note that publication thresholds are defined for disposable income indicators based on the total number of households or individuals in the area with positive or zero disposable income. Deciles are available only for IRIS areas with more than 1,000 taxable individuals and more than 500 taxable households whose disposable income is positive or zero.
The IRIS areas for which the indices could be calculated cover 75% of the
population
population
The universe of a survey composed of basic statistical units. These units may be physical persons, households, companies, municipalities, etc. The population serves as a sampling frame for selecting a sample, and as a basis for calculation of the extrapolations from the sample.
Find out more
aged 6 and older. In the
Médiamat
Médiamat
Registered name, the Médiamat is the benchmark in television audience measurement in France. Carried out by Médiamétrie, it provides daily audience figures for programmes watched anywhere, on any screen, live, timeshifted, on replay or preview, by all French people aged 4 and over, i.e. 62.4 million individuals.
The measurement is based on 2 representative panels :
- A first panel of around 12,000 individuals in 5,500 households, comprising :
• 5,000 households equipped with home TV sets, each connected to a fixed audimeter, the source of home TV audience measurement
• 500 households without home TV sets
- A second panel of around 5,000 individuals carrying a personal portable meter to measure TV audiences out of home (all screens) and on Internet screens at home. These audiences are then attributed to the individuals in the first panel by statistical fusion. The Médiamat allows Médiamétrie to monitor audience behaviour on a daily basis, while offering the possibility of both editorial and advertising analysis.
Find out more
panel
panel
A sample from which information is collected over time. It can be questioned several times at regular intervals. This method is pertinent for studying changes in behaviour.
The sample can be questioned continuously:
- either: each individual in the panel is asked to fill in a daily questionnaire relating to the subject of the study. This is the case for the Radio panel.
- or the information is recorded and returned regularly. This is the case for the Médiamat panel. This method is pertinent for understanding behavioural patterns and their changes if the panel lasts long enough.
Find out more
, they correspond to 71.5% of individuals aged 6 and older, and in the AIP panel, they correspond to 75.9% of individuals aged 15 and older.
The indices were then sorted to identify the top 10%, 5%, and 1%. We then compare the theoretical
distribution
distribution
This refers to the distribution of a variable; “structure” is also used with this meaning. In statistics, for each x value of a quantitative variable, the distribution function gives the proportion of individuals having a variable value that is less than or equal to x.
Find out more
of these top groups with the distribution observed in the Panel, based on the individuals for whom the IRIS was valid.
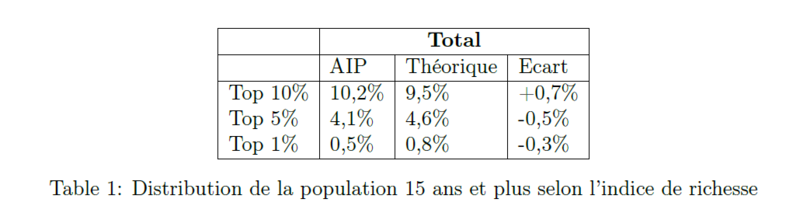
Analysis Framework: 10.2% of individuals aged 15 and older in the AIP, residing in an IRIS classified according to the wealth index, live in an IRIS ranked among the top 10% wealthiest, compared to 9.5% of all individuals aged 6 and older in France; representing a difference of +0.7 percentage points.
Table 1 shows relatively small differences between the AIP
panel
panel
A sample from which information is collected over time. It can be questioned several times at regular intervals. This method is pertinent for studying changes in behaviour.
The sample can be questioned continuously:
- either: each individual in the panel is asked to fill in a daily questionnaire relating to the subject of the study. This is the case for the Radio panel.
- or the information is recorded and returned regularly. This is the case for the Médiamat panel. This method is pertinent for understanding behavioural patterns and their changes if the panel lasts long enough.
Find out more
and the theoretical structure for all of France, particularly among the top 1% of the wealthiest IRIS areas, which demonstrates the panel’s good geographic
dispersion
dispersion
In statistics, dispersion is the variability in the value set. The usual indicators used to measure the dispersion of a set of values about the average value are variance and standard deviation. In surveys, geographical dispersion refers to the distribution of the sample over the territory as a whole.
Find out more
and the presence of panellists even in the most affluent neighborhoods.
These results shed light on our panels but have their limitations. One limitation is the granularity of the
data
data
Digital data
Find out more
. Since we cannot directly classify our panellists, we work at the IRIS level, implicitly assuming that a panellist residing in an IRIS is
representative
representative
A sample is said to be representative when it has been generated via a representative draw, meaning that each individual in the population had a non-zero probability of being selected. Representativeness relates to the sample and not to a unit of the population. It is not synonymous with a proportional sample or a "reduced model" of the population studied. In survey theory, it has been demonstrated that an optimal sampling strategy consists of organising the sample according to the variables that are most correlated to the subject of the study.
Find out more
of the indicator associated with that IRIS. It should also be noted that the 5,826 individuals aged 15 and older in the Panel are distributed across 5,135 distinct IRIS areas, or 1.20 individuals per IRIS, as of the
study
study
Any research done across a population, line of business, or products (programme content, programme schedules, etc.) A study relies most often on the data coming out of a survey (or surveys).
Find out more
date.
3. Measuring Diversity Through Entropy
Drawing on the literature on school segregation[1, 2] and the application of this theory to residential segregation based on standard of living[4], we explore entropy as an indicator for measuring social diversity.
3.1 Definition & Theoretical Framework
The entropy index we will use is itself derived from Shannon’s work on information theory[4].
Definition 1. Let P be a probability probability The probability of an event is a real number between 0 and 1 that reflects the chance of that event occurring. An impossible event has a probability of 0; a certain event has a probability equal to 1. The theory and calculation of probabilities are the basis of mathematical statistics and polls. Find out more measure. If P is defined on {1, ..., n}, with P(i) = pi and Σpi = 1, we obtain:
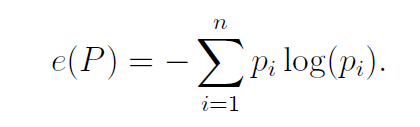
Entropy measures the internal diversity of a
distribution
distribution
This refers to the distribution of a variable; “structure” is also used with this meaning. In statistics, for each x value of a quantitative variable, the distribution function gives the proportion of individuals having a variable value that is less than or equal to x.
Find out more
. It is interpreted relatively: high entropy indicates a homogeneous distribution across classes, while low entropy indicates a high concentration.
Definition 2. Let Z be an
universe
universe
All the statistical units from which a survey sample is drawn. When these units are people, the universe is termed a population.
Find out more
divided into K zones Zk. Individuals belong to one of l classes of the given characteristic X. For each zone Zk, the distribution of X across the l categories is as follows: Pk = (p1k , ..., plk ).
P = (p1, ..., pl) is the distribution of X across the l categories in the Universe Z. πk is the proportion of units in zone Zk.
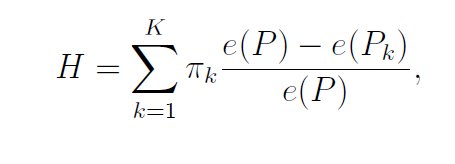
The entropy index is defined as follows:
where:
• e(Pk) represents the diversity of the modalities of X within zone Zk,
• e(P) represents the diversity of the modalities of X in the
universe
universe
All the statistical units from which a survey sample is drawn. When these units are people, the universe is termed a population.
Find out more
Z.
H represents the sum of the relative deviations between the diversity within each unit Zk and that of the overall zone Z.
A low entropy index H indicates a balanced
distribution
distribution
This refers to the distribution of a variable; “structure” is also used with this meaning. In statistics, for each x value of a quantitative variable, the distribution function gives the proportion of individuals having a variable value that is less than or equal to x.
Find out more
, where each zone Zk mirrors the overall distribution. Conversely, a high entropy index is characteristic of significant heterogeneity among each zone Zk.
To analyze diversity, it is important that the chosen indicator satisfy certain properties [2], notably the principles of composition invariance and scale invariance. The first principle means that if a social group increases in the
Total Population
Total Population
This refers to household populations as well as some communities (workers' hostels, retirement homes, university residences, prisons, etc.), the homeless, seamen and people living in mobile homes.
Find out more
, and this increase is reflected in the same proportions in each zone Zk, then segregation remains unchanged. The second principle states that segregation remains unchanged if the total number of units in a zone Zk increases, as long as their relative distribution among the zones is not altered.
3.2 Applications and Perspectives
The entropy index H allows for the comparison of levels of segregation or diversity between geographic zones. Building on the theoretical framework outlined above:
– the
study
study
Any research done across a population, line of business, or products (programme content, programme schedules, etc.) A study relies most often on the data coming out of a survey (or surveys).
Find out more
population
population
The universe of a survey composed of basic statistical units. These units may be physical persons, households, companies, municipalities, etc. The population serves as a sampling frame for selecting a sample, and as a basis for calculation of the extrapolations from the sample.
Find out more
Z will alternately be the
Médiamat
Médiamat
Registered name, the Médiamat is the benchmark in television audience measurement in France. Carried out by Médiamétrie, it provides daily audience figures for programmes watched anywhere, on any screen, live, timeshifted, on replay or preview, by all French people aged 4 and over, i.e. 62.4 million individuals.
The measurement is based on 2 representative panels :
- A first panel of around 12,000 individuals in 5,500 households, comprising :
• 5,000 households equipped with home TV sets, each connected to a fixed audimeter, the source of home TV audience measurement
• 500 households without home TV sets
- A second panel of around 5,000 individuals carrying a personal portable meter to measure TV audiences out of home (all screens) and on Internet screens at home. These audiences are then attributed to the individuals in the first panel by statistical fusion. The Médiamat allows Médiamétrie to monitor audience behaviour on a daily basis, while offering the possibility of both editorial and advertising analysis.
Find out more
panel
panel
A sample from which information is collected over time. It can be questioned several times at regular intervals. This method is pertinent for studying changes in behaviour.
The sample can be questioned continuously:
- either: each individual in the panel is asked to fill in a daily questionnaire relating to the subject of the study. This is the case for the Radio panel.
- or the information is recorded and returned regularly. This is the case for the Médiamat panel. This method is pertinent for understanding behavioural patterns and their changes if the panel lasts long enough.
Find out more
, the AIP panel, or the whole of France,
– the study universe Z will be divided into K departments, where Zk is a given department k,
– pi corresponds to the distributions of the socio-demographic
variable
variable
A computer or statistical object that groups the same information for all individuals in the study population. For example, the AGE variable represents the age of all the individuals of the population studied. Variables can be qualitative (e.g., GENDER or SPG) or quantitative (e.g., AGE or HEIGHT).
Find out more
classes.
The results of this analysis will be presented at the 14th Francophone Conference on Surveys.
References
[1] Gabrielle Fack, Julien Grenet, and Asma Benhenda. “The Impact of Zoning and Assignment Procedures on Social and Academic Diversity in High Schools in the Île-de-France
Region
Region
Geographic division. Mainland France is organised into 13 administrative regions (INSEE regions - there were previously 22 regions).
Find out more
.” PhD thesis. Institute of Public Policy (IPP), 2014.
[2] Pauline Givord et al. “How to Measure Segregation in the Education System?” In: Éducation & formations 91 (2016), pp. 21–51.
[3] Argyro Gripsiou and Christophe Bergouignan. “Internal Socioeconomic Polarization in the Central Neighborhoods of French Provincial Metropolises.” In: Espace populations sociétés. Space populations societies 2022/2-3 (2022).
[4] Salomon Jean-Bernard. “Decomposition of the normalized entropy index for the study of segregation.” In:
INSEE
INSEE
The Institut National de la Statistique et des Études Économiques (National Institute for Statistics and Economic Studies) is a general directorate of France's Ministry of the Economy, Finance, and Industry. INSEE carries out several sample surveys in the socio-economic field (households, companies), in addition to its responsibilities for the national accounts and taking the census (last completed in March 1999). This government agency is responsible for coordinating official statistics, reference data produced by the entire public statistics system.
Find out more
Conference on Statistical Methodology (2025).
[5] et al. Carole Pornet. “Construction of an adaptable European transnational ecological deprivation index: the French version.” In: J Epidemiol Community Health (66, 2012), pp. 982–989.
[6] Fouillet, A., et al., Rey, G., and Jougla, E. “Ecological association between a deprivation index and mortality in France over the period 1997–2001: variations with spatial scale, degree of urbanization, age, gender, and cause of death.” In: BMC Public Health (33, 2012).
Abstract
Social diversity within panels is a central issue for the representativeness of audience measurement audience measurement Quantitative study of the frequency of use of media. Find out more , in a context where the collection and processing processing Means any operation or set of operations which is performed on personal data or on sets of personal data, whether or not by automated means, such as collection, recording, organisation, structuring, storage, adaptation or alteration, retrieval, consultation, use, disclosure by transmission, dissemination or otherwise making available, alignment or combination, restriction, erasure or destruction Find out more of sensitive data sensitive data Sensitive data is a special category of personal data. This is information which reveals the alleged racial or ethnic origin, political opinions, religious or philosophical beliefs or trade union membership, as well as the processing of genetic data, biometric data for the purpose of uniquely identifying a natural person, data concerning health or data concerning the sexual life or sexual orientation of a natural person. GDPR prohibits collecting or using this data, except, in particular, in the following cases: if the data subject has given their express consent (active, explicit and preferably written approach, which must be free, specific, and informed); if the information is clearly made public by the data subject; if they are necessary to safeguard human life; if their use is justified by the public interest and authorised by the CNIL; if they concern the members or adherents of a political, religious, philosophical, political or union association or organizsation. Find out more is strictly regulated. This paper develops an indirect approach to measuring the social diversity of Médiamétrie panel panel A sample from which information is collected over time. It can be questioned several times at regular intervals. This method is pertinent for studying changes in behaviour. The sample can be questioned continuously: - either: each individual in the panel is asked to fill in a daily questionnaire relating to the subject of the study. This is the case for the Radio panel. - or the information is recorded and returned regularly. This is the case for the Médiamat panel. This method is pertinent for understanding behavioural patterns and their changes if the panel lasts long enough. Find out more surveys, based on the use of territorial socio-economic indices computed at the infra-municipal level (IRIS). Two deprivation indices—the French Deprivation Index (FDep) and the European Deprivation Index (EDI)—as well as poverty and wealth indices derived from income deciles are used to characterize the panels. The observed distributions are compared with those of the French population population The universe of a survey composed of basic statistical units. These units may be physical persons, households, companies, municipalities, etc. The population serves as a sampling frame for selecting a sample, and as a basis for calculation of the extrapolations from the sample. Find out more in order to identify potential distortions in representativeness. Finally, the paper explores entropy as a synthetic indicator of social diversity, making it possible to move beyond marginal comparisons and to analyse the internal dispersion dispersion In statistics, dispersion is the variability in the value set. The usual indicators used to measure the dispersion of a set of values about the average value are variance and standard deviation. In surveys, geographical dispersion refers to the distribution of the sample over the territory as a whole. Find out more of panels in a comprehensive manner. This approach opens up methodological perspectives for a more refined management of panel diversity.