
Evaluation of Resquin’s Contribution to the Detection of Inattention and the Enhancement of Quality Controls
By Antoine Calzavara, Data Data Digital data Find out more Analyst, and Fabienne Le Sager, Director of the Statistics Statistics Statistics or Data Science is a field of mathematics that studies phenomena through data collection, processing, analysis, graphical representation and visualisation (Data Visualisation), as well as the interpretation of results. Find out more Department - Médiamétrie
14th Francophone Conference on Surveys, 19-22 May 2026, Vannes
Too Straight to Be Honest?
Introduction
The rise of online response methods, along with the associated decline in production costs, has made their use inevitable for many organizations responsible for conducting quantitative surveys. While beneficial in many ways, these developments present well-known and well-documented challenges for the quality of the data collected. The development of multimodal protocols is partly the result of this dual objective of efficiency and data quality.

To ensure that balancing the constraints of time, quality, and cost in self-report surveys does not become an inevitable trade-off, we aim to deepen our understanding of how our
survey
survey
A statistical method that aims to produce information about a population by interviewing part of the population (sample). This word is generally used to mean a survey conducted on a sample that have been interviewed using a questionnaire or else systematically observed.
Find out more
methods impact
data
data
Digital data
Find out more
quality. Whether referred to as “satisficing” or “fraud,” the risks of losing measurement accuracy and quality are increasingly prevalent. This work is therefore part of our ongoing effort to improve our evaluation protocols.
How can we integrate, calibrate, and enhance the various methods for evaluating data quality to strengthen the robustness of detection processes, while taking into account the diversity of data collection modes and recruitment modes, and in light of our understanding of the mechanisms by which respondents complete Questionnaires?

2. Data Data Digital data Find out more and Protocols
2.1 Analysis Protocol
This article reports on ongoing tests, the findings of which will be presented at this 14th International Francophone Symposium on Surveys. They will focus on a corpus of declarative and
Barometer
Barometer
By analogy with meteorology, this term designates any regular measurement that can give an account of changes in audience, opinion, image, etc.
Find out more
studies conducted by Médiamétrie in 2025.
The various studies in our corpus all share the common feature of using repetitive questions that present a series of evaluation items (rating, agreement,
Frequency
Frequency
In electronics, the frequency characterises a vibrating motion, such as an electromagnetic wave: it is the number of times the phenomenon is produced per second (the unit of measurement is the Hertz). In statistics, it is the number of times an event takes place, expressed as a percentage. In computing, it expresses the power of a computer's processors. For example: Pentium III 650 MHz
Find out more
), which we refer to here as “scale sequences.” In our context, scale sequences are questions with multiple ordered options asked of respondents regarding their knowledge of or consumption of a range of media, or their habits in general (see examples below). This
question
question
An inquiry posed in the same way to all participants in the same survey, with the goal of obtaining answers of the same nature. We distinguish closed questions whose responses are chosen from the options provided (scales, yes / no, classification options, etc.), from open-ended questions for which no answer categories are offered. In the latter case, the spontaneous answer of the interviewee is gathered.
Find out more
format is central to comparative measurement, but it introduces redundancy that can affect respondent engagement and, consequently, data quality. This characteristic can be leveraged to identify inattentive respondents by testing targeted evaluation methods that focus specifically on these scales. The use of the R package Resquin—and in particular its non-differentiation and pattern indicators—will thus enable the construction of an initial score for suspected inattention by identifying responses that resemble patterns rather than reflecting actual or plausible behaviors.
This initial approach will be cross-referenced and supplemented by an analysis of
completion
completion
The video completion rate is an important indicator used to assess the effectiveness of video advertising broadcast on digital media. It is measured in terms of the proportion of the audience that views a video in its entirety. The term is often used to designate the average proportion of a video viewed. For example, a video completion rate of 50% means that, on average, the video is viewed halfway through.
Find out more
times, used as a contextualizing factor rather than as a standalone
criterion
criterion
A computer or statistical object that groups the same information for all individuals in the study population. For example, the AGE variable represents the age of all the individuals of the population studied. Variables can be qualitative (e.g., GENDER or SPG) or quantitative (e.g., AGE or HEIGHT).
Find out more
for detecting inattention. In particular, we will examine the extent to which responses identified as suspicious based on these indicators are associated with
outlier
outlier
In statistics, this is an atypical or aberrational data point that deviates from the model which holds for most of the data, i.e., it differs greatly from the "normal" values measured. Excluding outliers can make average estimates more significant.
Find out more
response times, and more broadly, assess the consistency between response patterns and the pace of
Questionnaire
Questionnaire
A structured, standardised set of questions that are posed in the same way to survey participants. A questionnaire often includes filter questions and the response to these will influence subsequent questions.
Find out more
completion.
Finally, the development of these indicators will enhance our understanding of the effectiveness of so-called “blinder” questions—trick questions for which a specific response pattern is explicitly expected from the respondent in order to assess potential inattention—in fulfilling their intended role in studies that employ them. Various versions of these questions, included in the Questionnaires of the two studies in this corpus that were administered exclusively online, will be analyzed for this purpose. Respondents initially excluded from the
study
study
Any research done across a population, line of business, or products (programme content, programme schedules, etc.) A study relies most often on the data coming out of a survey (or surveys).
Find out more
due to failure on these questions have also been re-included in the study’s scope as part of this research.
The primary strength of our corpus lies in its diversity and the inclusion of a multimodal
Survey
Survey
A statistical method that aims to produce information about a population by interviewing part of the population (sample). This word is generally used to mean a survey conducted on a sample that have been interviewed using a questionnaire or else systematically observed.
Find out more
, offering the opportunity to compare different modes of data collection (by telephone and online) and different sampling frames (by telephone/randomly generated numbers and via Access Panels), including those that do not have equivalent value in terms of data quality: the inclusion of data collected by telephone provides a solid point of comparison for isolating the effect of the collection
mode
mode
In statistics, the mode is the most common value.
Find out more
on quality indicators, without presuming that this collection mode guarantees flawless quality.
2.2 Characteristics of the Studies
The selected corpus is composed of the following three studies:
- Study 1: Barometer Survey No. 1, conducted in the fourth quarter of 2025,
sample
sample
A subset of the population studied, selected in accordance with a sampling plan, and subject to the collection of information.
Find out more
of 3,000 individuals aged 15–80, data collection: 100%
CAWI
CAWI
This acronym stands for Computer Assisted Web Interview. CAWI surveys refer to all types of online survey with automated administration and processing.
Find out more
,
Sampling Frame
Sampling Frame
List of individuals or statistical units forming a population within which one wishes to draw a sample, and from which the information required will be gathered. For example, the entire group of telephone subscribers may constitute the sampling frame of certain studies.
Find out more
: two separate Access Panels managed by external providers.
- Study 2: Barometer Survey No. 2, conducted in the fourth quarter of 2025, sample of 4,000 individuals aged 15–80, data collection: 100% CAWI, Sampling Frame: two separate Access Panels managed by external providers. The respondent pool is distinct from that of Barometer Survey No. 1.
- Study 3: Mixed-mode test survey (CATI followed by
CATI
CATI
This acronym stands for Computer Assisted Telephone Interview – a way of administering a survey. A CATI survey is a telephone survey in which the interviewer uses software to conduct the questionnaire and also input the respondent's answers.
Find out more
or CAWI), conducted in June 2025, sample of 3,800 individuals aged 13 or older, data collection: initial telephone
contact
contact
In media planning, a contact refers to an individual's exposure to an advertisement. In radio parlance, this is Opportunity to Hear (OTH) and for TV, Internet, press, cinema and poster advertisements, it is called Opportunity to See (OTS).
Find out more
followed by the option to complete the Survey online; the Sampling Frame consisted primarily of randomly selected numbers.
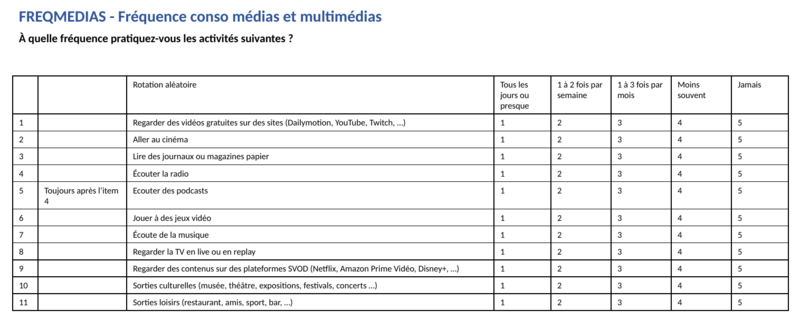
The use of the first two studies makes it possible to assess the relevance of the new indicators for differentiated scales, placed at distinct positions within the Questionnaires. By way of illustration, an example of a scale as presented to respondents in Barometer Study No. 1 is provided below.
The third survey survey A statistical method that aims to produce information about a population by interviewing part of the population (sample). This word is generally used to mean a survey conducted on a sample that have been interviewed using a questionnaire or else systematically observed. Find out more , meanwhile, provides an opportunity to examine these indicators within the framework of a multimodal approach including telephone contact contact In media planning, a contact refers to an individual's exposure to an advertisement. In radio parlance, this is Opportunity to Hear (OTH) and for TV, Internet, press, cinema and poster advertisements, it is called Opportunity to See (OTS). Find out more . It also allows for a comparison of the results obtained depending on the data data Digital data Find out more collection method: telephone vs. online.
3. Detailed Methodological Approach
3.1 Selection of Quality Indicators and Operational Definition
The analysis of scale-based questions takes advantage of their repetitive—and thus conducive to satisficing — and comparable nature to effectively assess the quality of responses and, by extension, respondent inattention. In this context, the R Resquin package provides both indicators and a conceptual framework suited to our analyses. It allows us to calculate the following four sets of indicators:
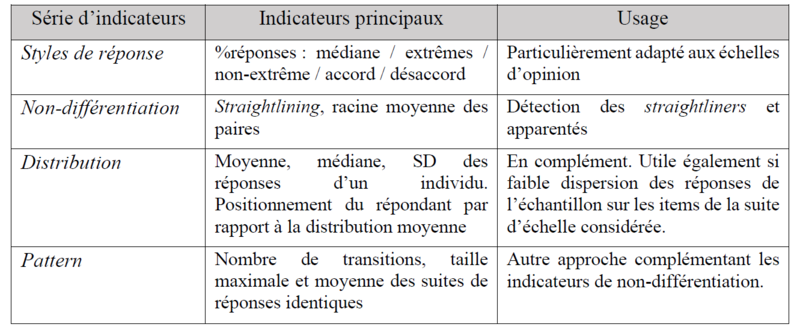
Several of these indicators are particularly relevant in the context of an analysis of agreement scales—that is, when the scale values allow for a position between total rejection and total agreement with the measured attitude: This is particularly true of the set of response style indicators and the Mahalanobis distance indicator, which assesses the positioning of a respondent’s answers relative to other responses in the
sample
sample
A subset of the population studied, selected in accordance with a sampling plan, and subject to the collection of information.
Find out more
. The nature of the scales in our corpus renders these methods ineffective; we will therefore exclude them from the scope of our analysis.
We will thus focus more specifically on an analysis of non-differentiation and response patterns. These indicators are based on theoretical foundations well established in the literature on
data
data
Digital data
Find out more
quality. “Straightliners” thus refer to behaviors characterized by the systematic repetition of the same response option and often associated with a lack of cognitive engagement. Other signals, such as flattened distributions or sequences of extremely regular responses, reflect strategies of cognitive
economy
economy
Indicator for evaluating formats in the context of a media plan. This is the prioritisation of formats according to their cost per thousand or another economic indicator.
Find out more
(satisficing) and, at times, even automated behaviors.
We will therefore, of course, begin by identifying straightliners, who represent the ideal-typical example of fraudulent respondents on scale sequences. Beyond that, we will use more refined criteria such as the
average
average
The average is one of the most important statistical indicators for a set of numbers. By default, it is the arithmetic mean, calculated by adding the values in the set and then dividing that sum by the number of values.
Find out more
deviation between successive responses, the number of transitions, the length of the longest sequence of identical responses, or the average length of sequences of successive responses. While these indicators can help detect weak signals, they may prove insufficient on their own to classify a respondent as inattentive. The combination of different quality assessment methods is central ICI, as it allows us to evaluate both the relevance of these indicators of weak signals and the calibration of their thresholds.
Finally, metadata analysis provides an additional contribution to assessing response quality by using
completion
completion
The video completion rate is an important indicator used to assess the effectiveness of video advertising broadcast on digital media. It is measured in terms of the proportion of the audience that views a video in its entirety. The term is often used to designate the average proportion of a video viewed. For example, a video completion rate of 50% means that, on average, the video is viewed halfway through.
Find out more
times as indicators of the actual conditions under which data were collected. Metadata will help refine the characterization of respondents suspected of inattention by analyzing their response patterns. When this information is available, this analysis of completion times will be conducted by
Questionnaire
Questionnaire
A structured, standardised set of questions that are posed in the same way to survey participants. A questionnaire often includes filter questions and the response to these will influence subsequent questions.
Find out more
module to increase precision and limit sensitivity to ordinary pauses.
4. Areas of Analysis for Evaluating the Value and Scope of the Research
Below, we present the areas of analysis selected to evaluate the indicators’ ability to effectively identify inattentive behaviors, as well as their relevance in the context of our surveys.
4.1 Analysis Framework: Effect of Recruitment Method
Our first analysis framework concerns the impact of the recruitment method on
data
data
Digital data
Find out more
quality. Thus, analyzing the Resquin indicators calculated from the two online
Barometer
Barometer
By analogy with meteorology, this term designates any regular measurement that can give an account of changes in audience, opinion, image, etc.
Find out more
studies will allow us to evaluate:
- The quality of data from respondents belonging to an
Access Panel
Access Panel
A sample of households or individuals who have been recruited to regularly answer surveys in return for remuneration (gift vouchers, money-off vouchers, lotteries, etc.) Using self-administered questionnaires (sent by post, e-mail or telephone), the sample can respond to targeted studies quickly.
Find out more
, after application of the pre-filters implemented by our providers, by comparing the prevalence of inconsistencies identified in these online surveys with those in the multimodal
study
study
Any research done across a population, line of business, or products (programme content, programme schedules, etc.) A study relies most often on the data coming out of a survey (or surveys).
Find out more
(possibly by limiting the comparison to
CATI
CATI
This acronym stands for Computer Assisted Telephone Interview – a way of administering a survey. A CATI survey is a telephone survey in which the interviewer uses software to conduct the questionnaire and also input the respondent's answers.
Find out more
respondents only).
- The value of complementary methods for evaluating and filtering data, by observing the
convergence
convergence
Coming together of domains or applications linked with technologies based on similar functions. Thus, the emergence and increased commonality of the digital signal allow for the convergence of the audio-visual, consumer electronics, computing, and telecommunications sectors.
Find out more
rate between the Resquin indicators and so-called “blinder” questions.
This research focus therefore aims to determine in which recruitment contexts detection methods would most effectively improve the quality of our data.
4.2 Analysis Focus: Effect of Collection
Mode
Mode
In statistics, the mode is the most common value.
Find out more
The simultaneous presence of data collected by telephone and online within a multimodal
survey
survey
A statistical method that aims to produce information about a population by interviewing part of the population (sample). This word is generally used to mean a survey conducted on a sample that have been interviewed using a questionnaire or else systematically observed.
Find out more
will allow us to assess the specific impact of the response mode on respondent inattention. We will thus analyze:
- The prevalence of suspicious data by mode.
- The distinct impact of the Mode effect on structural respondent behavior, assuming that certain signals identified in the online data collection will also be observed in the telephone data collection.
This line of analysis will help better define the added value of CATI as a benchmark and determine to what extent detection tools must be adapted to each Mode.
4.3 Analysis Area: Complementarity Among Indicators
Beyond the effects related to recruitment mode and data collection mode, the key objective of this study is to evaluate the combined value of various indicators of inattention. We will also assess the individual ability of so-called “blinder” questions to measure inattention in light of the indicators calculated using Resquin. Thus, we aim to:
- Compare the prevalence of different inattention indicators.
- Characterize the convergence or non-convergence of the Resquin indicators with the “blinder” questions.
- Determine whether inattention indicators are correlated with
completion
completion
The video completion rate is an important indicator used to assess the effectiveness of video advertising broadcast on digital media. It is measured in terms of the proportion of the audience that views a video in its entirety. The term is often used to designate the average proportion of a video viewed. For example, a video completion rate of 50% means that, on average, the video is viewed halfway through.
Find out more
times.
This section aims to demonstrate how a multi-indicator system provides a more robust assessment than a single indicator.
4.4 Parameterization of the Various Indicators
With a view to implementing these detection methods in practice, the
question
question
An inquiry posed in the same way to all participants in the same survey, with the goal of obtaining answers of the same nature. We distinguish closed questions whose responses are chosen from the options provided (scales, yes / no, classification options, etc.), from open-ended questions for which no answer categories are offered. In the latter case, the spontaneous answer of the interviewee is gathered.
Find out more
of indicator parameterization is also central. The sensitivity and interpretation of these indicators depend on multiple factors, including the nature of the information collected across the scales, their placement within the
Questionnaire
Questionnaire
A structured, standardised set of questions that are posed in the same way to survey participants. A questionnaire often includes filter questions and the response to these will influence subsequent questions.
Find out more
—since satisficing behavior is likely to increase toward the end of the survey—as well as the number of items comprising each scale. These factors directly influence the
probability
probability
The probability of an event is a real number between 0 and 1 that reflects the chance of that event occurring. An impossible event has a probability of 0; a certain event has a probability equal to 1. The theory and calculation of probabilities are the basis of mathematical statistics and polls.
Find out more
of observing consistent response patterns, without these patterns necessarily being interpreted uniformly as signs of inattention.
Consequently, a significant part of our work involves assessing the impact of these parameters on the detection of inattentive respondents, which entails testing various combinations. Among these parameters, we focus in particular on determining thresholds tailored to the properties of each scale sequence—number of sub-questions, number of response options, homogeneity of items, possible presence of filters, and
non-response
non-response
People solicited to participate in a statistical survey do not always respond - in this case they are called non-responses. “Total non-response” cases (when a person contacted for a survey does not respond to any question at all) are distinguished from “partial non-response” cases (when the interviewee responds to some questions, but not others).
Find out more
rate.
Conclusion
This
study
study
Any research done across a population, line of business, or products (programme content, programme schedules, etc.) A study relies most often on the data coming out of a survey (or surveys).
Find out more
proposes a structured application of the Resquin package to detect non-differentiation and pattern behaviors in our surveys, as a complement to existing traditional quality
control
control
All the operations implemented to verify the quality of information gathering: the work of the interviewers, the participation of the interviewees, progress against objectives, etc.
Find out more
measures. It will help identify the conditions necessary for robust implementation: defining consistent threshold values, integrating scores into quality processes, and anticipating interactions between Resquin and existing Controls.
The consolidated results and key findings will be presented at the conference.
Bibliography
- Kennedy, C., Hatley, N., Lau, A., Mercer, A., Keeter, S., Ferno, J., and Asare‑Marfo, D. (2020), Two common checks fail to catch most bogus cases. Pew Research Center, Methodology Report. https://www.pewresearch.org/methods/2020/02/18/two-common-checks-fail-to-catch-most-bogus-cases/
- Kennedy, C., Mercer, A., and Lau, A. (2024), “An Examination of the Hypothesis That Respondents to Non-probabilistic Online Surveys Conducted for Commercial Purposes Respond in Good Faith,”
Survey
Survey
A statistical method that aims to produce information about a population by interviewing part of the population (sample). This word is generally used to mean a survey conducted on a sample that have been interviewed using a questionnaire or else systematically observed.
Find out more
Methods,
Statistics
Statistics
Statistics or Data Science is a field of mathematics that studies phenomena through data collection, processing, analysis, graphical representation and visualisation (Data Visualisation), as well as the interpretation of results.
Find out more
Canada, Ottawa.
- Reuning, K., and Plutzer, E. (2020), “Valid vs. Invalid Straightlining: The Complex Relationship Between Straightlining and
Data
Data
Digital data
Find out more
Quality,” Survey Research Methods, 14(5), 439–459.
- Roth, M., Bhaktha, N., Bluemke, M., Knopf, T., Krämer, F., Lechner, C., & Yildiz, Ç. (2025). resquin: Response Quality Indicators for Survey Research (Version 0.1.1) [R package]. Comprehensive R Archive Network (CRAN). https://CRAN.R-project.org/package=resquin
Abstract
The growing use of web surveys (CAWI), combined with the increasing diversity of
survey
survey
A statistical method that aims to produce information about a population by interviewing part of the population (sample). This word is generally used to mean a survey conducted on a sample that have been interviewed using a questionnaire or else systematically observed.
Find out more
designs, reinforces the need to better characterize inattentive response behaviors that may compromise
data
data
Digital data
Find out more
quality. In this context, we apply the resquin package to a heterogeneous corpus of studies conducted by Médiamétrie—including surveys collected exclusively via access‑panel
CAWI
CAWI
This acronym stands for Computer Assisted Web Interview. CAWI surveys refer to all types of online survey with automated administration and processing.
Find out more
and a mixed‑mode
CATI
CATI
This acronym stands for Computer Assisted Telephone Interview – a way of administering a survey. A CATI survey is a telephone survey in which the interviewer uses software to conduct the questionnaire and also input the respondent's answers.
Find out more
/CAWI survey—in order to assess the operational relevance of its indicators. We focus in particular on non‑differentiation and response pattern indicators to identify straightlining behaviors and other response profiles potentially indicative of inattention. The analysis is further enriched by additional data quality signals available in the corpus, such as response times and attention check questions (blinders) embedded in the CAWI surveys.
The diversity of this
study
study
Any research done across a population, line of business, or products (programme content, programme schedules, etc.) A study relies most often on the data coming out of a survey (or surveys).
Find out more
corpus, in terms of both data collection modes and recruitment strategies, provides a suitable framework for a detailed and contextualized examination of these 2 data quality indicators. It also allows us to explore the respective contributions of
mode
mode
In statistics, the mode is the most common value.
Find out more
and recruitment effects in the measurement of inattention, while distinguishing them from more structural response behaviors.
The aim of this work is to highlight the need to contextualize the interpretation of each data quality indicator and to show how their combined use can serve as an effective lever to refine the diagnosis of inattention across various survey contexts.