
Sample Adjustment: Principles and Methods
Sample adjustment involves correcting sample distortions to bring its structure closer to that of the population under study. Through margin calibration or algorithms such as CALMAR and Ridge, it helps limit bias, enhance statistical precision, and improve the reliability of survey-based indicators.
What is a representative sample?
A survey survey A statistical method that aims to produce information about a population by interviewing part of the population (sample). This word is generally used to mean a survey conducted on a sample that have been interviewed using a questionnaire or else systematically observed. Find out more is not a Census Census A technique for gathering information across the entire population, in contrast to a survey, which by definition only applies to a sample. Normally, a census involves an exhaustive count during which some additional socio-demographic questions are asked. Example: the national population census in France by INSEE which publishes results annually. Find out more . A survey is a method that involves questioning a portion of the population population The universe of a survey composed of basic statistical units. These units may be physical persons, households, companies, municipalities, etc. The population serves as a sampling frame for selecting a sample, and as a basis for calculation of the extrapolations from the sample. Find out more —a sample sample A subset of the population studied, selected in accordance with a sampling plan, and subject to the collection of information. Find out more —and analyzing it in order to extrapolate the sample’s results to the entire population. All surveys are subject to various types of error error There are different types of errors in surveys : coverage error (the sampling base does not correspond exactly to the population studied), non-response error (a part of the sample does not wish to answer certain questions), measurement error (the value declared by the individual is incorrect) and sampling error (only a part of the population is observed). The combination of these errors - the total error - is the difference between the survey-estimated value and the (generally unknown) “true value” of the parameter in the population. Find out more , the main one being sampling error. This is due to the random nature of the drawing of a sample.
To control control All the operations implemented to verify the quality of information gathering: the work of the interviewers, the participation of the interviewees, progress against objectives, etc. Find out more sampling error and improve the accuracy of survey results, auxiliary information is used. This information is collected during the Survey, and its values are known for the entire population. This information can be used at several stages: during the design of the Sampling Plan with stratification or quotas, or during data data Digital data Find out more processing processing Means any operation or set of operations which is performed on personal data or on sets of personal data, whether or not by automated means, such as collection, recording, organisation, structuring, storage, adaptation or alteration, retrieval, consultation, use, disclosure by transmission, dissemination or otherwise making available, alignment or combination, restriction, erasure or destruction Find out more with adjustment adjustment A statistical processing that aims to correct structural discrepancies on one or more variables between the sample and the entire population studied (based on a known structure, such as a census or a framing study). This processing involves the calculation of a so-called adjustment coefficient for each individual surveyed. The coefficient is then combined with the extrapolation to arrive at its weight and thus align the weighted sample's structure to the structure of the population. Find out more .


Why is sample adjustment essential?
A sample sample A subset of the population studied, selected in accordance with a sampling plan, and subject to the collection of information. Find out more cannot be an exact replica of the population population The universe of a survey composed of basic statistical units. These units may be physical persons, households, companies, municipalities, etc. The population serves as a sampling frame for selecting a sample, and as a basis for calculation of the extrapolations from the sample. Find out more under study study Any research done across a population, line of business, or products (programme content, programme schedules, etc.) A study relies most often on the data coming out of a survey (or surveys). Find out more . If “raw” results are published, the resulting picture of reality is distorted.
Adjustment Adjustment A statistical processing that aims to correct structural discrepancies on one or more variables between the sample and the entire population studied (based on a known structure, such as a census or a framing study). This processing involves the calculation of a so-called adjustment coefficient for each individual surveyed. The coefficient is then combined with the extrapolation to arrive at its weight and thus align the weighted sample's structure to the structure of the population. Find out more (or calibration) involves correcting sample distortions retrospectively based on a number of criteria, by assigning each respondent a weight weight 1. The proportion of a category of individuals in relation to the entire population. For example, on January 1st, 2020, the weight of women was 51.7% of the household population. 2. The survey weight refers to the coefficient assigned to each individual in the sample, and which corresponds to the inverse of the probability that they belong to the sample. For example, for a sample of 20,000 individuals drawn at random from a population of 40 million, the survey weight is 2,000. 3. The adjustment weight refers to the coefficient assigned to each individual after the sample adjustment, and which corresponds to the number of people in the population that are represented by this individual in the sample. Find out more that reflects their representation within the Population. In practical terms, an individual belonging to an underrepresented category will receive a weight greater than 1 (their response will “count more”), and vice versa for an overrepresented category.
The challenge is twofold:
- Reliability: ensuring that the published indicators are not biased due to the sample structure.
- Accuracy: Adjustment for factors correlated with the variables of interest reduces the variance variance The variance of a statistical distribution is the average of the squares of the differences between the values of the distribution and their average. A standard deviation is always determined by first finding the variance, then taking the square root. Find out more of the estimates and improves the precision of the results.
Principle of sample adjustment: How are the weights calculated?
Reliable information on the population population The universe of a survey composed of basic statistical units. These units may be physical persons, households, companies, municipalities, etc. The population serves as a sampling frame for selecting a sample, and as a basis for calculation of the extrapolations from the sample. Find out more is available, such as INSEE INSEE The Institut National de la Statistique et des Études Économiques (National Institute for Statistics and Economic Studies) is a general directorate of France's Ministry of the Economy, Finance, and Industry. INSEE carries out several sample surveys in the socio-economic field (households, companies), in addition to its responsibilities for the national accounts and taking the census (last completed in March 1999). This government agency is responsible for coordinating official statistics, reference data produced by the entire public statistics system. Find out more data data Digital data Find out more for sociodemographic criteria. The goal is to ensure that the structure of the sample sample A subset of the population studied, selected in accordance with a sampling plan, and subject to the collection of information. Find out more , once weighted, matches this reference data for each selected criterion criterion A computer or statistical object that groups the same information for all individuals in the study population. For example, the AGE variable represents the age of all the individuals of the population studied. Variables can be qualitative (e.g., GENDER or SPG) or quantitative (e.g., AGE or HEIGHT). Find out more .
Simple case: a single criterion
If we wish to perform an adjustment adjustment A statistical processing that aims to correct structural discrepancies on one or more variables between the sample and the entire population studied (based on a known structure, such as a census or a framing study). This processing involves the calculation of a so-called adjustment coefficient for each individual surveyed. The coefficient is then combined with the extrapolation to arrive at its weight and thus align the weighted sample's structure to the structure of the population. Find out more on the sample based on a single criterion—gender, for example—then this involves a simple rule of three. For example, if women account for 52% of the population but only 40% of the sample, each woman is assigned a weight weight 1. The proportion of a category of individuals in relation to the entire population. For example, on January 1st, 2020, the weight of women was 51.7% of the household population. 2. The survey weight refers to the coefficient assigned to each individual in the sample, and which corresponds to the inverse of the probability that they belong to the sample. For example, for a sample of 20,000 individuals drawn at random from a population of 40 million, the survey weight is 2,000. 3. The adjustment weight refers to the coefficient assigned to each individual after the sample adjustment, and which corresponds to the number of people in the population that are represented by this individual in the sample. Find out more of 52/40 = 1.30 and each man a weight of 48/60 = 0.80.
Classic case: multiple criteria—margin-based weighting
In practice, adjustments are made simultaneously across multiple criteria (gender, age, SPG categories SPG categories The SPG (socio-professional category), was replaced in 1982 by the classification of Professions and Socio-professional Categories (PCS), a nomenclature defined by France’s INSEE, which classifies the population according to a combination of profession (or former profession), hierarchical position and status (employee or otherwise). Find out more , Region Region Geographic division. Mainland France is organised into 13 administrative regions (INSEE regions - there were previously 22 regions). Find out more , type of housing, etc.). Generally, only the marginal distributions are known, without having access to all the cross-distributions. The margin-based adjustment method therefore consists of finding weights that satisfy all these margins at once, while remaining as close as possible to the initial weights.
This is a constrained optimisation optimisation Processing by which a solution that meets pre-defined constraints is sought among a variety of possible solutions to a problem. Example: optimisation of a programme schedule under the constraint of a minimum cumulative audience, or optimisation of an advertising campaign with a budget constraint. Find out more problem: we minimize a distance function between the survey survey A statistical method that aims to produce information about a population by interviewing part of the population (sample). This word is generally used to mean a survey conducted on a sample that have been interviewed using a questionnaire or else systematically observed. Find out more weights and the calibration weights, subject to the constraint that the margins be exactly satisfied.

What are the main methods of sample adjustment?
The iterative RAS method: gradually adjusting the sample sample A subset of the population studied, selected in accordance with a sampling plan, and subject to the collection of information. Find out more weights
The most intuitive method is RAS (Raking Adjustment Adjustment A statistical processing that aims to correct structural discrepancies on one or more variables between the sample and the entire population studied (based on a known structure, such as a census or a framing study). This processing involves the calculation of a so-called adjustment coefficient for each individual surveyed. The coefficient is then combined with the extrapolation to arrive at its weight and thus align the weighted sample's structure to the structure of the population. Find out more System or iterative proportional fitting). The principle is simple:
1. First, adjust the weights so that the margin for the first criterion criterion A computer or statistical object that groups the same information for all individuals in the study population. For example, the AGE variable represents the age of all the individuals of the population studied. Variables can be qualitative (e.g., GENDER or SPG) or quantitative (e.g., AGE or HEIGHT). Find out more (e.g., gender) is exact.
2. Then we readjust so that the margin for the second Criterion (age) is met—which may slightly distort the first margin.
3. We repeat the process for the first criterion, and so on, in a loop.
At each iteration, the weights are multiplied by the ratio of the theoretical margin to the estimated margin in the weighted sample:
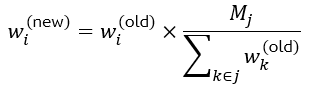
where Mj is the total population total population This refers to household populations as well as some communities (workers' hostels, retirement homes, university residences, prisons, etc.), the homeless, seamen and people living in mobile homes. Find out more in category j, and the denominator is the current weighted total in that category.
The algorithm generally converges within a few iterations. Its underlying distance function is G(x) = x log log A file containing a history of events. By extension, it also describes an event in itself, for example the launch of an app on a smartphone with the launch time and the app name. Find out more (x) − x + 1, which guarantees strictly positive weights. However, it can produce very high weights if the deviations between the sample sample A subset of the population studied, selected in accordance with a sampling plan, and subject to the collection of information. Find out more and the Population Population The universe of a survey composed of basic statistical units. These units may be physical persons, households, companies, municipalities, etc. The population serves as a sampling frame for selecting a sample, and as a basis for calculation of the extrapolations from the sample. Find out more are large.
INSEE INSEE The Institut National de la Statistique et des Études Économiques (National Institute for Statistics and Economic Studies) is a general directorate of France's Ministry of the Economy, Finance, and Industry. INSEE carries out several sample surveys in the socio-economic field (households, companies), in addition to its responsibilities for the national accounts and taking the census (last completed in March 1999). This government agency is responsible for coordinating official statistics, reference data produced by the entire public statistics system. Find out more ’s CALMAR macro, a benchmark method for margin-based calibration
Developed by INSEE, the CALMAR macro (CALage sur MARges) formalizes calibration as an Optimisation Optimisation Processing by which a solution that meets pre-defined constraints is sought among a variety of possible solutions to a problem. Example: optimisation of a programme schedule under the constraint of a minimum cumulative audience, or optimisation of an advertising campaign with a budget constraint. Find out more problem: finding the weights wk that minimize a distance function G with respect to the Survey Survey A statistical method that aims to produce information about a population by interviewing part of the population (sample). This word is generally used to mean a survey conducted on a sample that have been interviewed using a questionnaire or else systematically observed. Find out more weights dk, subject to the calibration constraints:

The system is solved using Newton's algorithm. The CALMAR macro offers five asymptotically equivalent distance functions: in practice, the choice among them is guided by the shape of the weight weight 1. The proportion of a category of individuals in relation to the entire population. For example, on January 1st, 2020, the weight of women was 51.7% of the household population. 2. The survey weight refers to the coefficient assigned to each individual in the sample, and which corresponds to the inverse of the probability that they belong to the sample. For example, for a sample of 20,000 individuals drawn at random from a population of 40 million, the survey weight is 2,000. 3. The adjustment weight refers to the coefficient assigned to each individual after the sample adjustment, and which corresponds to the number of people in the population that are represented by this individual in the sample. Find out more distribution distribution This refers to the distribution of a variable; “structure” is also used with this meaning. In statistics, for each x value of a quantitative variable, the distribution function gives the proportion of individuals having a variable value that is less than or equal to x. Find out more and by the desire to avoid extreme values.
The Ridge approach: a more flexible method when there are many criteria
When there are many criteria or they are partially collinear, the system of equations may become unstable or fail to converge. The Ridge approach (or L2 regularization) offers a solution by adding a penalty term to the system matrix.
In the context of parameter estimation, instead of solving β^ = (X' X)-1 X' Y, we solve:
β^ridge = (X' X + λI)-1 X' Y
The parameter λ > 0 regularizes the matrix X' X by making it better conditioned: values close to zero are “raised,” which stabilizes the inversion. The trade-off is a slight
bias
bias
The bias of a statistical result is the difference between the result obtained and the exact value that one is seeking. There are three distinct types of bias: sampling bias (for example: using an unsuitable sampling frame), observational bias (for example: poor wording of a question or answer grid), and estimate bias (for example: not fully taking into account the categories for drawing the sample).
Find out more
in the coefficients, offset by a substantial reduction in
Variance
Variance
The variance of a statistical distribution is the average of the squares of the differences between the values of the distribution and their average. A standard deviation is always determined by first finding the variance, then taking the square root.
Find out more
.
In practice, this approach is useful when:
The number of calibration criteria is high relative to the
Sample Size
Sample Size
The number of statistical units constituting a sample. The accuracy of a survey depends greatly on the sample size.
Find out more
;
The auxiliary information is itself derived from surveys and subject to Margins of
Error
Error
There are different types of errors in surveys : coverage error (the sampling base does not correspond exactly to the population studied), non-response error (a part of the sample does not wish to answer certain questions), measurement error (the value declared by the individual is incorrect) and sampling error (only a part of the population is observed). The combination of these errors - the total error - is the difference between the survey-estimated value and the (generally unknown) “true value” of the parameter in the population.
Find out more
;
A “flexible” calibration is desired that does not strictly adhere to the margins but produces more stable weights.
Key Points on Sample Adjustment
Adjustment Adjustment A statistical processing that aims to correct structural discrepancies on one or more variables between the sample and the entire population studied (based on a known structure, such as a census or a framing study). This processing involves the calculation of a so-called adjustment coefficient for each individual surveyed. The coefficient is then combined with the extrapolation to arrive at its weight and thus align the weighted sample's structure to the structure of the population. Find out more is not a cosmetic exercise: when done properly, it significantly improves the accuracy of estimates. The choice of method depends on the context, the number of criteria, the quality of the baseline data data Digital data Find out more , and operational constraints.