
Data Merging: Definition, Methods and Challenges for Audience Research and Audience Measurement
Data fusion allows for the combination of multiple information sources from separate surveys to reconstruct a more comprehensive picture of the same population. This method is widely used in studies and Audience Measurement when it becomes difficult to collect all the desired information from the same individuals. It addresses a twofold challenge: maintaining the quality of data collection while producing rich and actionable results.
Why use data merging?
Against a backdrop of declining reach reach Reach is the term used to describe the reach achieved by a medium, publication, advertisement or campaign. It corresponds to the number of users reached and is therefore quantitative data. Reach plays a key role in measuring return on investment. It is used to determine whether or not the communication is effective. Whether for a website or a social network, reach corresponds to the proportion of the Internet user population or the audience reached by the site or network over a set period. Find out more and survey survey A statistical method that aims to produce information about a population by interviewing part of the population (sample). This word is generally used to mean a survey conducted on a sample that have been interviewed using a questionnaire or else systematically observed. Find out more response rates, data data Digital data Find out more collection has become a major challenge. To reduce the response burden*, market research firms must design questionnaires that are shorter, simpler, and better suited to real-world data collection conditions.
Thus, rather than collecting all the desired information from a single sample sample A subset of the population studied, selected in accordance with a sampling plan, and subject to the collection of information. Find out more , one can choose to collect some of the variables of interest from a first sample and the rest from a second sample, distinct from the first. The challenge, then, is to combine these multiple sources of information in order to obtain a complete picture.
This is precisely the problem addressed by statistical matching statistical matching The statistical matching method is used to reconcile data collected from different surveys. It consists of complementing a so-called "recipient" sample, where certain information is not present, with a so-called "donor" sample relating to other individuals. To do this, the two samples must contain common information, called bridging variables. Statistical matching is a particular way of handling non-responses. Find out more (also known as data fusion): combining two independent sources—which cover the same population population The universe of a survey composed of basic statistical units. These units may be physical persons, households, companies, municipalities, etc. The population serves as a sampling frame for selecting a sample, and as a basis for calculation of the extrapolations from the sample. Find out more but collect different information—to create a single, comprehensive database database All the homogeneous data collected over the course of several surveys and whose structure provides the potential for tailor-made consultations and inquiries. Find out more .
*The “response burden” refers to the burden (in terms of time, memory effort, complexity, etc.) placed on survey respondents. It is a central concept in survey methodology because it directly influences the quality of participation and the reliability of responses.


The Origins and Development of Data Integration
The first experiments emerged in the mid-1960s, independently in Germany, France, and the United Kingdom. They were conducted by private institutes seeking to cross-reference the audiences of different media—print, radio, and television. As the number of media outlets continued to grow, the “Single Source” model—a single survey survey A statistical method that aims to produce information about a population by interviewing part of the population (sample). This word is generally used to mean a survey conducted on a sample that have been interviewed using a questionnaire or else systematically observed. Find out more covering all media—reached its limits, both in terms of cost and the burden on respondents.
In the United States and Canada, public statistics statistics Statistics or Data Science is a field of mathematics that studies phenomena through data collection, processing, analysis, graphical representation and visualisation (Data Visualisation), as well as the interpretation of results. Find out more agencies conduct the research, particularly to merge administrative records whose exact cross-referencing is prohibited by privacy regulations (the Privacy Act of 1974). Statistics Canada contributed significantly in the 1990s to the improvement of these techniques, particularly regarding the assumption of conditional independence.
The use of data data Digital data Find out more merging then became widespread in the 1980s and 1990s in the fields of market research and media audience measurement audience measurement Quantitative study of the frequency of use of media. Find out more , as it offers a solution that is both cost-effective—a complete data collection would be expensive—and practical—the merged dataset can be directly processed using standard software.
What is the general principle behind data merging?
The principle is simple. We have two samples, A and B, drawn from the same Population Population The universe of a survey composed of basic statistical units. These units may be physical persons, households, companies, municipalities, etc. The population serves as a sampling frame for selecting a sample, and as a basis for calculation of the extrapolations from the sample. Find out more :
- Sample Sample A subset of the population studied, selected in accordance with a sampling plan, and subject to the collection of information. Find out more A contains variables X (e.g., sociodemographic variables) and variables Y;
- Sample B contains the same X variables and Z variables.
Y and Z are never observed together.
The goal is to create a file C in which each individual has X, Y, and Z.To do this, we designate a “recipient” file (A) and a “donor” file (B). For each individual i in the recipient file, we search the donor file for a “match” j, that is, an individual who most closely resembles them based on the common variables X. The Z values of the look-alike are then imputed to the recipient.
Conditional independence: the key assumption in data merging
Any fusion is based on a strong assumption: given X, the variables Y and Z are independent. In other words, we assume that the relationship between Y and Z is entirely explained by their respective relationships to X. This assumption cannot be verified directly since Y and Z are never observed together. This is why the explanatory power power Indicator for evaluating formats in the context of a media plan. This is the prioritisation of formats according to their target audience. Find out more of the common variable variable A computer or statistical object that groups the same information for all individuals in the study population. For example, the AGE variable represents the age of all the individuals of the population studied. Variables can be qualitative (e.g., GENDER or SPG) or quantitative (e.g., AGE or HEIGHT). Find out more X over Y and Z is crucial to the quality of the merger.
What are the main steps in a data merger?
The fusion process generally consists of four steps:
Step 1 — Select the most explanatory common variables
Not all X variables have the same predictive power power Indicator for evaluating formats in the context of a media plan. This is the prioritisation of formats according to their target audience. Find out more over Y and Z. Including non-significant variables can even degrade the fusion. Therefore, standard selection algorithms are used to retain only the most relevant common variables.
Step 2 — Stratify the samples to ensure comparability
We require perfect similarity between donors and recipients on a subset of key variables (gender, age group, etc.). We thus define K strata strata A stratification is a division of a population or a sample, into the most homogeneous groups possible. These groups are called strata. Find out more within which the matches are performed separately. This ensures, for example, that a woman aged 15–24 will never be matched with a 50-year-old man. Stratification also helps reduce computation time.
Step 3 — Calculate the distance matrix
Within each strata, we quantify the similarity between each recipient i and each donor j. Among the most commonly used distance functions are:
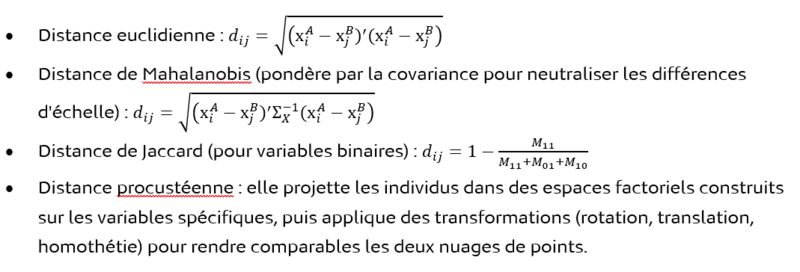
Step 4 — Choose an Appropriate Matching Method
There are many matching algorithms, including:
- Nearest Neighbor: each recipient i receives the closest donor j. This method is very simple to implement and minimizes the total distance, but the trade-off is a risk of significant replication of certain donors and the difficulty of preserving the marginal distributions of the Z variables.
- Matching with a no-duplication constraint: we minimize the total distance under the constraint that each donor is used only once. This is a classic optimisation optimisation Processing by which a solution that meets pre-defined constraints is sought among a variety of possible solutions to a problem. Example: optimisation of a programme schedule under the constraint of a minimum cumulative audience, or optimisation of an advertising campaign with a budget constraint. Find out more problem: the traveling salesman problem. There are many algorithms for solving this problem. The advantage of this method is that it allows for better preservation of the marginal distributions of the Z variables, but at the expense of the total distance and computation time.
- Matching under the weight weight 1. The proportion of a category of individuals in relation to the entire population. For example, on January 1st, 2020, the weight of women was 51.7% of the household population. 2. The survey weight refers to the coefficient assigned to each individual in the sample, and which corresponds to the inverse of the probability that they belong to the sample. For example, for a sample of 20,000 individuals drawn at random from a population of 40 million, the survey weight is 2,000. 3. The adjustment weight refers to the coefficient assigned to each individual after the sample adjustment, and which corresponds to the number of people in the population that are represented by this individual in the sample. Find out more -preservation constraint: the total distance is minimized under the constraint that the survey survey A statistical method that aims to produce information about a population by interviewing part of the population (sample). This word is generally used to mean a survey conducted on a sample that have been interviewed using a questionnaire or else systematically observed. Find out more weights of each unit are fully redistributed. This transportation problem is another classic linear linear This is when a live television program is watched exactly at the time it airs, in timeshifting (control over live TV) or private delay (personal recording). Find out more optimization problem. It can be shown that the optimal solution results in nA + nB -1 pairings.
Benefits, Limitations, and Considerations of Data Merging
Data
Data
Digital data
Find out more
merging is an effective, pragmatic solution that avoids the need for costly, exhaustive data collection from a single
sample
sample
A subset of the population studied, selected in accordance with a sampling plan, and subject to the collection of information.
Find out more
. It also reduces the response burden through shorter Questionnaires, which improves both response rates and data quality. The result is a comprehensive dataset that can be used directly in standard formats compatible with conventional analysis tools. Finally, it enables the production of
Cross Media
Cross Media
Advertising and marketing practice that consists of using multiple media for a campaign. The objective of a cross media campaign is to play on the complementarity between the various media used. With this in mind, the aim of the Cross Media Advertising workshops set up by Médiamétrie is to work with the market to develop a new cross-media advertising measure (for TV and digital) to respond to rapidly changing uses and offers.
Find out more
metrics using existing data sources without resorting to a single, complex
Panel
Panel
A sample from which information is collected over time. It can be questioned several times at regular intervals. This method is pertinent for studying changes in behaviour.
The sample can be questioned continuously:
- either: each individual in the panel is asked to fill in a daily questionnaire relating to the subject of the study. This is the case for the Radio panel.
- or the information is recorded and returned regularly. This is the case for the Médiamat panel. This method is pertinent for understanding behavioural patterns and their changes if the panel lasts long enough.
Find out more
.
On the other hand, data fusion relies on strong assumptions, particularly that of conditional independence: if the common variables do not sufficiently explain the specific variables, the model will struggle to reconstruct the relationships between the variables—such as duplications, for example. Furthermore, the merged dataset is the result of modeling rather than direct observation. The accuracy of the results cannot therefore be assessed using conventional
Margin of Error
Margin of Error
The interval in which the true value of the parameter being sought lies, according to a predefined confidence level. A 95% confidence interval is taken to mean an interval which has 95 chances out of 100 of containing the true value. It is calculated based on the standard deviation.
Find out more
calculations. Implementing a data merger thus requires a rigorous validation process to ensure the reliability of the results;