OTT Services – A public in love with content
This concerns VOD/SVOD, video platforms on the internet, dedicated applications such as MyCanal or MOLOTOV via a Smart TV, a router or a stick as is the case for Apple TV or Chromecast. In the third quarter of 2017, more than 1 household out of 10 had a router or a multimedia stick to connect to OTT services. At the same time, 1 web user out of 5 has access to a SVOD offer, a figure which is constantly rising. What is the impact of OTT on the way in which television and video content is watched?
The possibilities of watching TV content have changed drastically over the past years. Currently, TV is viewed in replay everyday by 6.9 million people, at rate of 1 hour 15 minutes per day. Television channels are rolled out on all screens and almost 5 million people watch TV programmes daily on internet screens, live or in replay. The latest phenomenon to date is video services on demand by subscription such as CanalPlay, Netflix, SFR Play, etc. For a monthly subscription of about ten euros, they offer access to video content basically centred around series and films, providing spectators with a wide choice to: watch their favourite programmes in a limitless sequence (this is called "binge watching"), when they want to, on the screen of their choice.
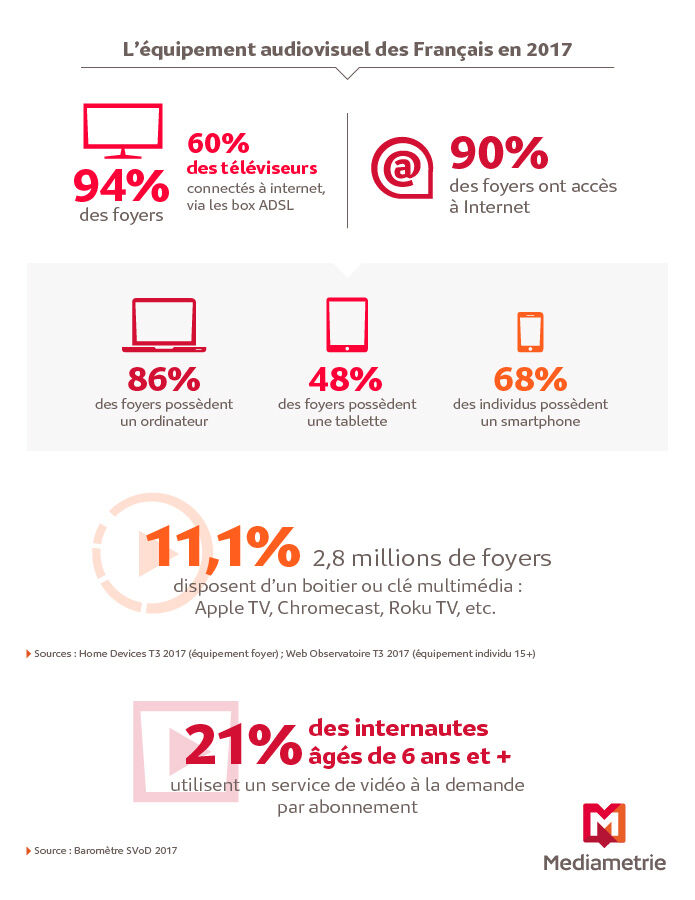
The availability and generalisation of high-speed internet, connection of TV sets, as well as the increase in the number of mobile phones have contributed to the development of these services. The television set is still the main screen that the French choose for viewing; there is one in 94% of households. A distinctive French feature is that almost 60% of these television sets are connected to the internet, mainly by a broadband router. 90% of households have access to the Internet, with evolving equipment: in the third quarter of 2017, almost 9 households out of 10 were equipped with a computer (86%) and almost a half (48%) with a tablet. At the same time, more than 2 people out of 3 have a smartphone.
2,8 million households are equiped with an OTT router
The development of OTT services was accompanied by that of specific equipment that makes it possible to watch all programmes on a television set. At present, more than 1 out of 10 (11.1%) households that access the internet (2.8 million households) have a router or a stick (Apple TV, Chromecast by Google, Roku TV, etc.) specially developed for OTT services.
These users want simplified use by connecting to their television set services to which it does not originally have access.
19% of these households subscribe to Canal+ (14% of all households) and a higher proportion of subscription to Canalsat can be noted among them.
Their global use of TV programmes and video is very close to that of the average age of 15 years and over. Although global television use is close to that of the French population, more of them watch on Internet screens (computer, tablet, smartphone). This population uses more content on VOD/ SVOD platforms.
1 in 5 web users has adopted SVOD services.
In 2017, 1 web user in 5 (21%) aged 6 years and over declared having experienced a video on demand service by subscription. These users are mainly urban youth, hyper-connected, and are fans of premium content.
Users of SVoD platforms are above all major consumers of TV and video content, particularly in their new formats: catch-up and Internet screens. In general, they watch more TV & video content than the 15+ group, a considerable amount of it on Internet screens. These people dedicate 13% of their “video”* time to SVoD.
In terms of their choice of screen, to watch long programmes they exhibit a clear preference for television screens: almost three quarters of SVoD users watch programmes on their television set.
* TV Live + TV catch-up/pre-recorded + VoD+ SVoD.
Three questions for Julien Rosanvallon, Director of Médiamétrie's TV and Internet Departments
How much of total video consumption is accounted for by OTT pratices ?
In France, we are unique in that we have a very extensive range of free television thanks top DTT and the catch-up platforms of channels. With a large amount of television being received as part of ADSL packages, TV viewers have access to a wide variety of programmes, at very affordable rates compared to the other countries. That, in combination with other factors such as regulations, certainly explains why the number of subscribers to a SVoD offer is still quite low (it is 60% in the United States). So subscription video on demand - which is admittedly seeing a sharp increase in popularity - today represents a small portion of the overall consumption of video content, in relation to the population as a whole : 2% of overall viewing time, compared with more than 95% for television.
However, it may be seen that in the SVoD subscribers population segments, this portion of time is much higher (13%).
How can these practices be integrated into the audience measurement ?
Médiamétrie has been measuring time-shifted registration-based TV audiences since 2011, and catch-up audiences since 2014. In 2016, Médiamétrie started measuring audiences of television on Internet screens (computers, tablets and smartphones), be it live, time-shifted or catch-up. Mediamat is an evolving measurement which we enhance on a continuous basis, and which is gradually integrating OTT consumption : the use of Molotov on 4 screens was added in September 2017, and MyCanal is about to join the 4-screen TV audience measurement. With regard to SVoD audience measurement, this is obviously an area we are working on : tests will begin in 2018.
Do you think that consumption of OTT content will increase ?
Yes, of course, because the public has an appetite for these new ways of consuming audiovisual content, particularly fiction : TV viewers have a strong liking for watching series on demand. Ficiton and films in particular represent 29% of consumption of live TV programmes and 50% of catch-up and time-shifted TV. In addition, we have found that TV screens are still the prefered screens for these new forms of consumption.
These OTT uses are a natural extension of the development of new time-shifted and catch-up TV viewing practices, whatever the screen. From the viewer's perpective, the line between these different types of content consumption is fading away. It is also possible to see a strong complementarity between the different screens and broadcasting means that meet the public's many expectations. But let's no forget that beyond the service aspects, the main issue raised by OTT is that of the content and new competition it will bring.
Laure Osmanian Molinero
des médias
edition
definitions