Converge to a global audience

After Collecting data to measure audiences here is the second instalment in our trilogy of articles devoted to technological innovation at Médiamétrie and its operational applications to enrich audience measurement and anticipate the changes to come.
TV set, computer, smartphone, tablet – and soon car, watch and other connected devices: more and more screens and networks are allowing users to listen to the radio or watch a programme or video. As these devices appear, Médiamétrie has successively developed processing chains by screen to transform raw data into audience data. These chains had lived side-by-side, isolated from each other, each meant for single-source data processing. Today, the challenge has become to learn a brand or a show's overall audience, however it is received. As a result, heterogeneous data from a diversity of sources needs to be processed.
In particular this research is being conducted at the DataLab, created by Médiamétrie 18 months ago, composed of data scientists, computer scientists and statisticians, all experts in data processing.
Converging data
When a processing chain is deployed for a data source, the specific processing applied to the data is determined by this source. The data produced by several processing chains is then not directly comparable between the sources.
With the multiplication of screens, and thus sources, processing to reconcile data at each chain's output is necessary to produce an overview.
Several methods to produce this reconciliation exist:
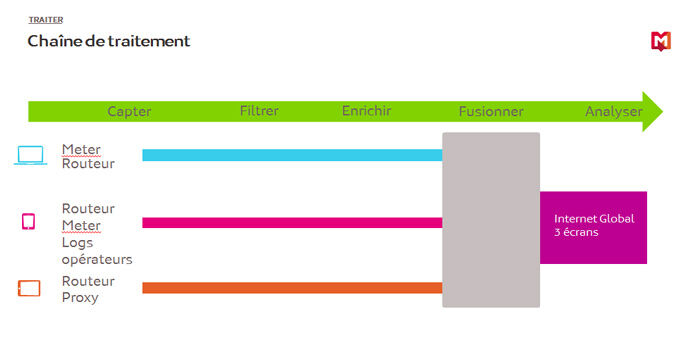
One example is the statistical merging of measurements. This method was used to produce the 3-screen total internet measurement – computer, mobile, tablet – the first results for which were published in April 2015. Statistical merging of measurements happens at the end of the processing chain, and allows a view of multi-device traffic (i.e. on 3 screens).
Now Médiamétrie is continuing towards the four-screen audience (TV, computer, mobile, tablet). To produce a reference measurement for the multi-screen market, the following step consists in processing the heterogeneity of this data from different sources, converging them as far upstream in processing the chains as possible. The goal is to make the results directly comparable at the output of each of the chains.
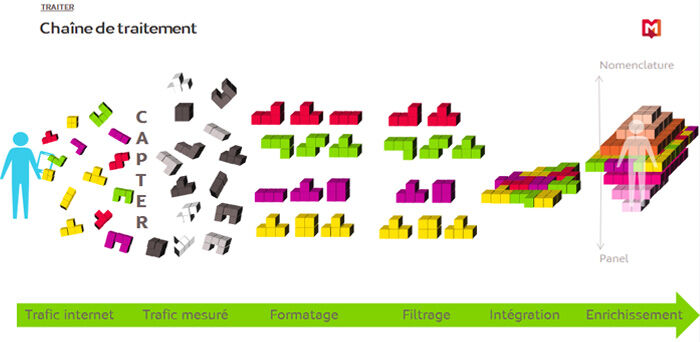
This is how it works: to analyse a given event – Mrs. X viewed site Y on her smartphone for 5 minutes, then made a purchase on her computer – the collected data (in this case from the smartphone and computer) must pass through the major steps in the processing chain.
The first steps are formatting and filtering the data. Formatting's goal is to homogenise all the web traffic information, no matter what screen they come from: each piece of information about the web traffic measured (date, time, device used, URL, etc.) is broken down, identified, then classified.
Once this technical convergence is done, data must be filtered according to conventions accepted by the market and area rules: for example, excluding URLs of images included in the site, or even advertising.
Then comes the data integration stage, for example individualising traffic. This phase gives meaning to the data.
Then enriching it
Finally comes the stage for enriching data with time, panel and nomenclature information. Harmonising the nomenclatures used by TV channels with those of websites is, further, one of the challenges to face in converging measurements.
All in all, the richness and volume of data collected and processed is considerable – from the number of visits, page views, time spent on a site, to the segmentation of audiences by sex, age, socio-professional category, housing, etc. Here begins the world of Big Data and its 3 Vs: Volume, Velocity and Variety.
By enriching data with sources from 3 dimensions – panel, nomenclature and time – an almost infinite number of queries, assessed at 10289, may be formulated. By way of comparison, cosmologists agree in estimating the number of atoms present in the observable universe at 1080.
Intuitively Médiamétrie calls on the approach of big data and its technologies to respond to such diverse questions as: "Do individuals in higher income groups connecting to news sites prefer to buy their vacations on a desktop computer or tablet? Evening or day?”
To answer this infinite number of possible queries, Médiamétrie has developed an innovative solution: an on-demand calculation engine to respond to questions that use data previously aligned.
In fact, "after the multi-screen or multi-device consumption approach, the next step is cross-device", explained Estelle Duval, Médiamétrie's Internet Director. "This means measuring how a single individual moves from his/her computer to tablet, then to a mobile during a single day, for example to view a news site. Through its
panels, Médiamétrie has the capacity to measure these uses. Once these data processing and hybridization chains are finalised for three screens, the addition of other data sources, such as those provided by connected devices, will be simpler to integrate."»
Come back soon for the third instalment in the trilogy: Restit TV, for audience results calculated on the fly
Isabelle Repiton and Isabelle Lellouche Filliau
des médias
edition
definitions