A new hybrid audience measurement for television

After the mobile internet audience measurement launched in 2010, then the hybridization of the Mediametrie//NetRatings fixed internet panel with frequency data in 2012, Médiamétrie developed a new hybrid measurement for TV audiences of special-interest channels.
It's an innovative method developed by Médiamétrie's statistician experts.
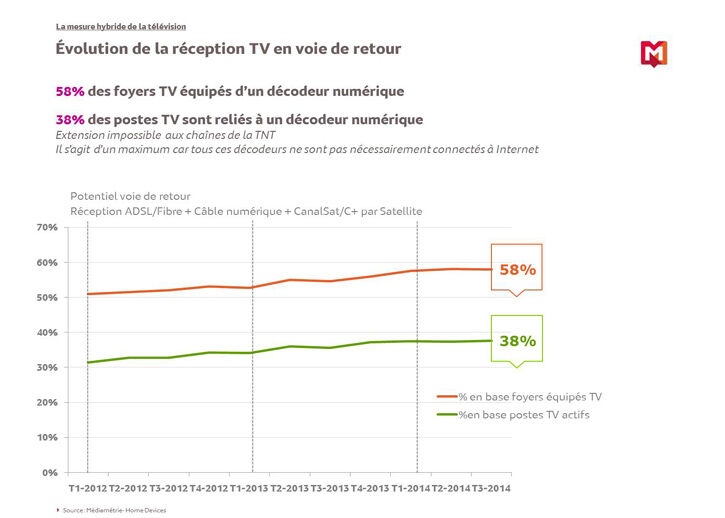
The arrival of digital technology led to a change in the media landscape. Fifty-eight percent of TV households are now equipped with cable, satellite or ADSL digital decoders that can connect to the internet. New data can be collected, almost in real time, letting one learn (for example) what is being viewed on the TV set at any given time. These new pieces of information, grouped under the term "logs", are valuable resources for enriching current TV audience measurements based on panels of individuals, especially for special-interest channels where the audience is increasingly fragmented. According to Benoît Cassaigne, Director of Audience Measurements at Médiamétrie, the goal is threefold for brands: "obtain a finer granularity, more frequent results and media planning data to better evaluate the advertising space of special-interest channels and to face up to internet competition". Seizing on an initial request from the Canal+ Group in 2012, Médiamétrie launched a research and development phase with CanalSat to contemplate and create a new hybrid TV measurement.
Hybridize to enrich
As emphasised by Aurélie Vanheuverzwyn, Analysis and Scientific Methods Director, "hybridization consists of mixing two sources of information of different kinds and different levels to create a new, finer, richer measurement". However, there is no universal method. Hybridization depends on the data at hand and the needs of the market. When measuring TV audiences, data comes partly from a survey based on a panel of subscriber households and individuals, and partly from logs collected by return path – that is, by decoders' connection to the internet. The scope of this measurement is necessarily limited, because while 58% of TV households are equipped with a digital decoder, only 38% of TV sets are connected to the decoders, which are not always connected to the internet. This 38% of TV sets, however, covers all reception of special-interest channels. Médiamétrie experts have favoured a "log-up" approach, which consists in enriching the first source, a sample of 10,000 CanalSat subscribers measured by return path, with the second source, estimated modelling from the reference TV audience measurement, the Médiamat panel.
A three-step strategy
The deployment of a hybrid measurement for TV presents two main difficulties. "First, it's necessary to filter return path data and sort through the collected logs, to select those that are truly useful and correspond to a TV session. Then audiences must be successfully individualised. To be clear, a TV set that is on does not mean anyone is watching. Forty percent of time spent in front of the TV is with other people", explained Lorie Dudoignon, Statistical Expert.
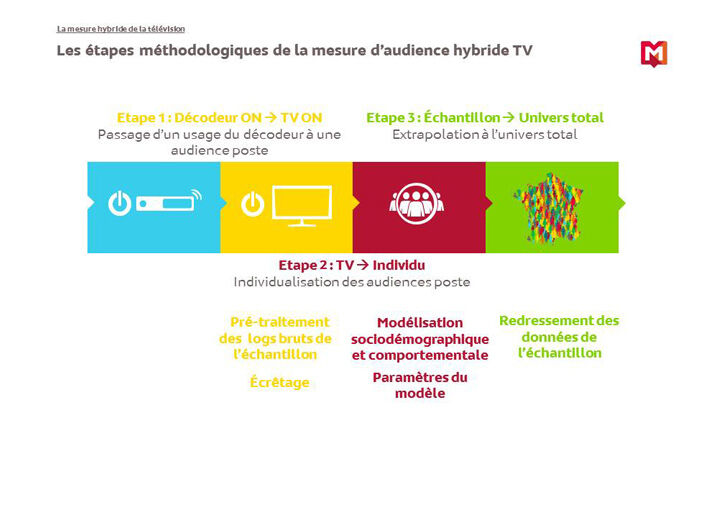
The method developed by Médiamétrie has three phases.
The first phase is the clipping of logs. This means tying a "decoder on" signal to an effective audience in front of the set. To do so, it is necessary to remove logs related to a decoder that is on while the TV is off. Clipping parameters are estimated using data from the reference TV audience measurement, Médiamat. Data not corresponding to TV consumption uses are also set aside. The remaining data serves to establish audience cards that include the audience starting time, ending time and channel watched.
The next step answers the question: who is watching television? This phase is the most difficult – one in which Médiamétrie's teams had to prove their innovation (see following section).
Finally, the third phase is extrapolation of results obtained on the sample to the total subscriber universe. To do this, the sample of return path subscribers must of course be representative of all subscribers. This requires an adjustment phase that, in this case, is similar to those used in most surveys.
From the TV set audience to an individual audience
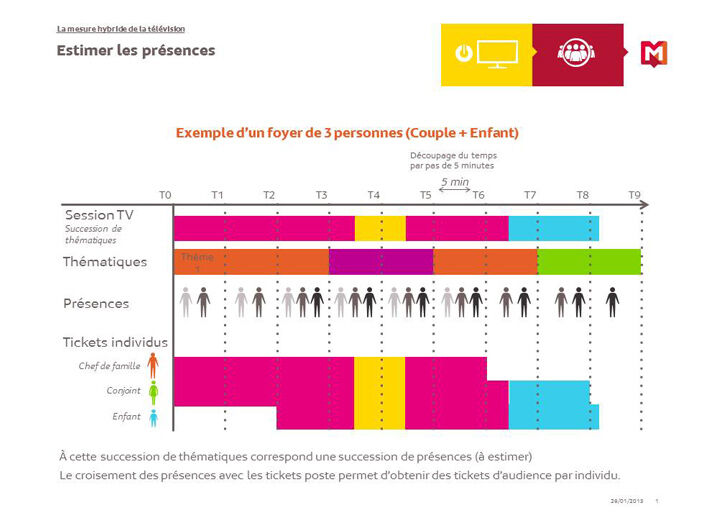
Who is really in front of the TV set? To determine this, socio-demographic and behavioural modelling is essential. This is done through a sample of households, characterised according to number of individuals, their sex, age, socio-professional category, as well as their family relationship. Next, each TV session is divided into five-minute steps (or sequences). Channels are grouped by theme, for more robust modelling of audiences. For each five-minute step, the theme predominantly watched (sport, music, children's programmes, etc.) is estimated. From this theme is estimated who is in front of the set, using modelling produced from the Médiamat panel. This in turn solves a problem that mathematicians refer to as the hidden Markov model: for each five-minute step, researchers seek to determine a hidden parameter (people who are watching TV), as the predominant theme is known. Further, the probability that those who are watching are not the same in the next five minutes only depends on the current state, and not on the people who were watching TV earlier in the day. While these hidden Markov models are well known to statisticians, Médiamétrie has innovated to adapt them to audience measurement.
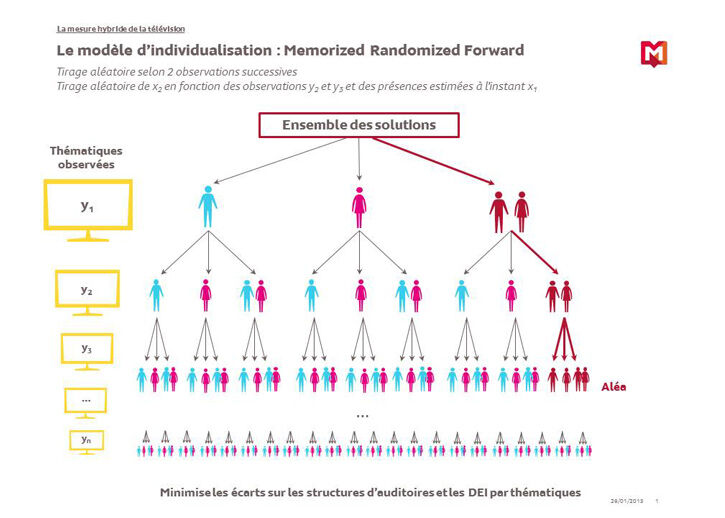
Estimating who is present in front of the TV is done by an individualisation algorithm. Statistical experts needed to test several in order to find the one that best represents the results obtained with Médiamat, which directly and precisely measures who is in front of the TV set at any given time. The number of possible solutions that the algorithm must explore depends on the household size. In the simple case of a couple, three situations are possible for one sequence: one of the people watches TV, the other person watches TV, or both people watch together. In the following sequence, each of these situations could change, which creates nine possibilities. In the end, for n sequences, there are 3n possible solutions. That's a lot: over 200 billion possible combinations for 2 hours of TV (24 5-minute sequences)! The algorithm cannot study them all in a reasonable period of time. Among the standard algorithms used in hidden Markov models, the "Viterbi" determines the most probable path from the theme being watched. But it produces audience structures that are too caricatured. For example, all sequences with a "children's" theme are assigned to an audience of children. Another example, the "Randomized Forward" algorithm, which consists in determining those present depending on the theme observed and presences estimated in the previous moment. In this case, audience structures are, on the contrary, too averaged out, i.e. audience structures will be almost the same for "sport" and "children's" themes. This is why Médiamétrie's statisticians have developed the "Memorized Randomized Forward" algorithm, which avoids these two pitfalls. This algorithm identifies the individuals present depending on the theme observed, the following theme and presences estimated at the previous instant. This allows estimating audiences very close to those actually observed in the panel. After the last phase extrapolating to all subscribers, a precise, quality hybrid measurement is obtained of the TV audience of special-interest channels.
R&D continues
This new service from Médiamétrie will soon be launched across the CanalSat universe. The following step aims to extend this hybrid measurement to other operators for a market measurement of special-interest channels. As for R&D, the next undertakings will be to harmonise the different formats of digital data received by return path, to merge and purge multi-subscribers to move to a multi-operator measurement, to account for catch-up TV in order to refine measurement of special-interest channels and to provide media planning tools.
Sylvain Guilbaud
des médias
edition
definitions